Tokenomics Calculator 2026: How to Model Token Economics Before Investors See a Single Red Flag
Most tokenomics templates stop at the pie chart. This guide covers what actually happens after listing: sell pressure, unlock overhang, DEX liquidity depth, and the 12-point red flag check institutional investors run before every pitch meeting.

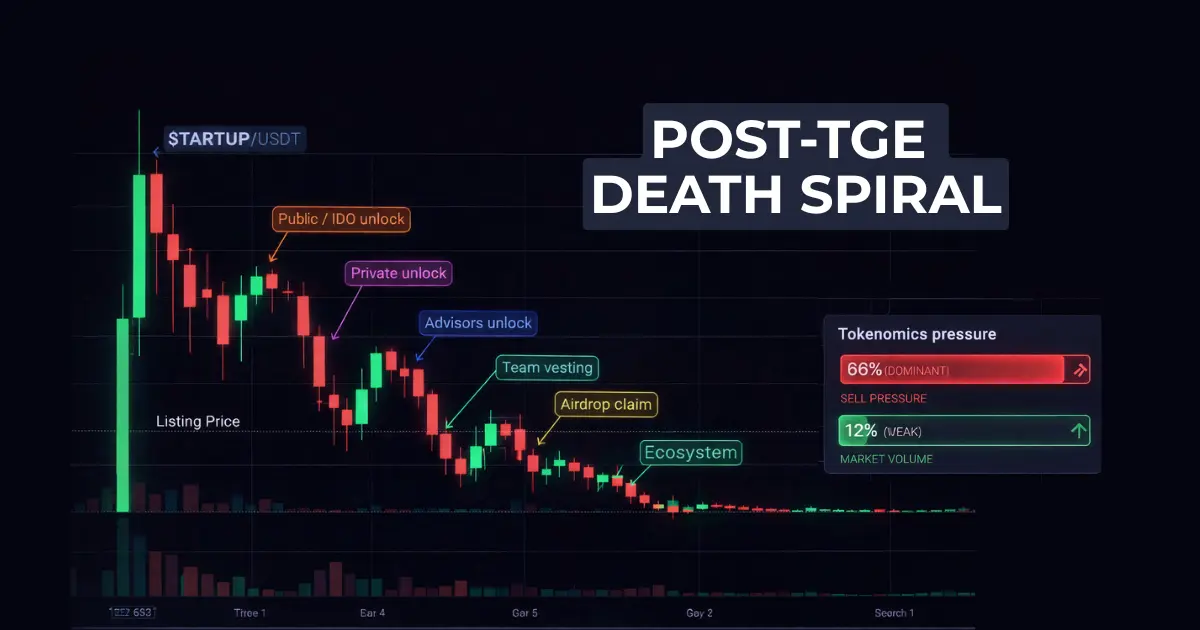
Look at the biggest token price crashes from 2024 and 2025. The pattern is almost identical across projects. A token lists with strong day-one volume. Momentum holds for a few weeks. Then a vesting cliff hits. Team tokens unlock. Early private round investors unlock. In some cases, advisors vest at the same time. The combined sell pressure swamps available trading volume. The chart breaks. The community blames whales. The project blames market conditions.
The problem started on a spreadsheet, usually six months before listing.
Tokens that unlock more than 25% of circulating supply within the first 90 days post-TGE face 2 to 4 times higher sell pressure than projects with gradual release schedules.
Evidence note (benchmark, not a guarantee): This 2–4× range is a recurring datapoint across unlock-mechanics research and analyst write-ups (2024–2025) and is directionally consistent with what investors model using public unlock trackers and historical volume/sell-through assumptions. Treat it as a stress-test baseline, then calibrate with your own volume + holder behavior.
By 2026, institutional investors run sell pressure models before taking a meeting. Founders who show up without having done the same analysis are at an immediate disadvantage. This guide covers how to build a model that holds up, where most templates fall short, and which metrics actually move the conversation in a fundraising room.
What a Tokenomics Model Actually Needs to Cover in 2026
Most tokenomics templates do one thing: divide a supply pie into allocation categories. That is a starting point, not a model.
A complete tokenomics model in 2026 has three distinct layers.
The allocation layer
This is what every template covers. Total supply, allocation categories (team, investors, ecosystem, public), vesting schedules, and cliff periods. Standard inputs. Required. But on its own, this layer tells you almost nothing about what will happen after your token lists.
The post-TGE reality layer
This is where most templates stop entirely. The post-TGE layer covers the 60-month cumulative unlock schedule, monthly sell pressure calculations, volume absorption ratios, DEX liquidity depth requirements, and overhang windows at 30, 90, 180, and 365 days. This is the layer where projects survive or collapse.
The scenario layer
This is what institutional analysts actually use. A scenario model applies Base, Bear, and Bull market assumptions simultaneously across volume, sell-through behavior, staking rates, and price stress. A model that only shows one future is not useful in an investor meeting, because investors will immediately test it against conditions you did not model.
Free and low-cost tokenomics templates almost never include the second or third layer. Writing a tokenomics document without them is roughly equivalent to writing a financial model that only shows the best-case outcome.
Step 1: Build Your Token Allocation Model
Define your supply and allocation categories
A complete allocation model covers at minimum eight categories: Team, Advisors, Private Round 1, Private Round 2 (if applicable), Public/IDO, Ecosystem/Treasury, Protocol Incentives or Play-to-Earn, and Liquidity Reserve.
Two thresholds that investors check in the first 60 seconds:
No single allocation round should hold more than 30% of total supply. When one group controls that share, one coordinated exit can permanently damage token price. Concentration risk triggers an automatic flag in most VC due diligence frameworks.
Healthy projects typically list with 5 to 12% of total supply in circulation at TGE. Below 5% creates artificial scarcity concerns and may not meet DEX listing minimums. Above 15% generates immediate sell pressure that early-stage tokens rarely have the volume to absorb.
Set vesting and cliff parameters
These two terms are often confused in early drafts and the confusion creates real modeling errors.
A cliff is a period during which no tokens release at all. Vesting is the schedule over which tokens release after the cliff ends. They are sequential, not interchangeable.
The industry standard for team tokens is a 12-month cliff followed by 36-month linear vesting: four years total.
Evidence note: “4-year vesting + 1-year cliff” is the most common baseline referenced across VC token terms and tokenomics template SERPs; investors often treat anything shorter as a commitment risk. Use it as default unless you can justify deviations with governance/lock mechanics.
Institutional VCs treat this as a floor, not an aspirational benchmark. A team cliff shorter than 12 months raises immediate questions about founder commitment and is flagged in most professional due diligence processes.
Advisors typically vest over 1 to 2 years with a 3-month cliff. Private investors in seed and Series A positions expect 12 to 18 months of post-TGE lockup before their vesting begins. Public or IDO allocations commonly release 10 to 25% at TGE, with the remainder vesting over 6 to 12 months.
The warning on public unlocks: even a 5% TGE unlock in a thin DEX market can generate more sell pressure than 24-hour volume supports. Model the number before you set it.
Build the 60-month unlock schedule
This is the step most founders skip and most templates do not support. You need a month-by-month view of cumulative circulating supply from Month 0 through Month 60.
The InnMind Tokenomics Calculator 2026 calculates this automatically in the 0Release Schedule tab, with 60 months of unlock data generated from your category vesting assumptions.
(If you want to inspect the structure before purchasing, the full overview is here: https://innmind.com/tokenomics-calculator/.)
If you are building this manually, do not guess. Write the schedule. Most token failures are visible in Month 12 and Month 24 convergence events.
Step 2: Model Your Sell Pressure Before Investors Do
What sell pressure means and how to calculate it
Token sell pressure is not the same thing as token unlocks.
Unlocks tell you how many tokens become available. Sell pressure tells you how many of those tokens will likely hit the market.
The difference matters.
Sell pressure is an estimate of how much USD value in tokens will be sold in a given month:
(Tokens unlocked that month) x (sell-through rate) x (1 minus staking absorption rate) x (token price)
The variable most founders underestimate is sell-through rate: what fraction of unlocked tokens do holders actually sell? This varies significantly by allocation type, and using a single blended rate produces a misleading model.
Observed ranges from 2023 to 2025 token markets:
- Private investors (early rounds): 25 to 35% of unlocked tokens sold per month
- Public IDO participants: 40 to 80%, driven by lower conviction and cost basis near listing price
- Team and advisors: 5 to 10%, because reputational exposure functions as a soft lock beyond formal vesting
- Ecosystem grant recipients (for infra projects): 2 to 8%, since most of these tokens fund protocol operations rather than personal liquidity
In short: private investors often sell aggressively to de-risk. Team members sell slowly and irregularly. Ecosystem allocations may not sell at all if they are tied to incentives or usage. The InnMind Tokenomics Calculator 2026 models sell-through rates by allocation type and lets you stress-test them under Base, Bear, and Bull market conditions.
Staking reduces effective sell pressure in proportion to the staking rate. If 40% of circulating supply is staked, that portion is temporarily removed from sell flow. The important caveat: effective staking lock rates in practice tend to run 30 to 60% lower than what founders assume during modeling, because staking participation drops when token price declines.
The volume absorption test
Sell pressure only creates a problem relative to available market volume. The ratio that matters:
Daily sell pressure divided by 7-day average volume
- Below 1%: low risk. The market absorbs the flow without visible price impact.
- 1 to 5%: medium risk. Measurable price impact occurs; requires weekly monitoring.
- Above 5%: high risk. Structural downward pressure is built into the token economy, and it will not self-correct.
To put concrete numbers to it: if Month 12 unlocks generate $800,000 in likely-to-sell tokens and your 7-day average volume is $2,000,000 (roughly $286,000 per day), your absorption ratio is 2.8%. That is in the medium-risk range. Manageable, but it needs active monitoring and ideally a staking or utility sink mechanism to offset some of the flow.
But why Month 12 breaks so many tokens?
Month 12 is where unlock convergence events typically begin.
Team cliff ends. Advisor cliffs end. Early private rounds begin vesting.
If those flows combine in the same month, the market must absorb a sudden spike.
This is the event investors will ask you about.
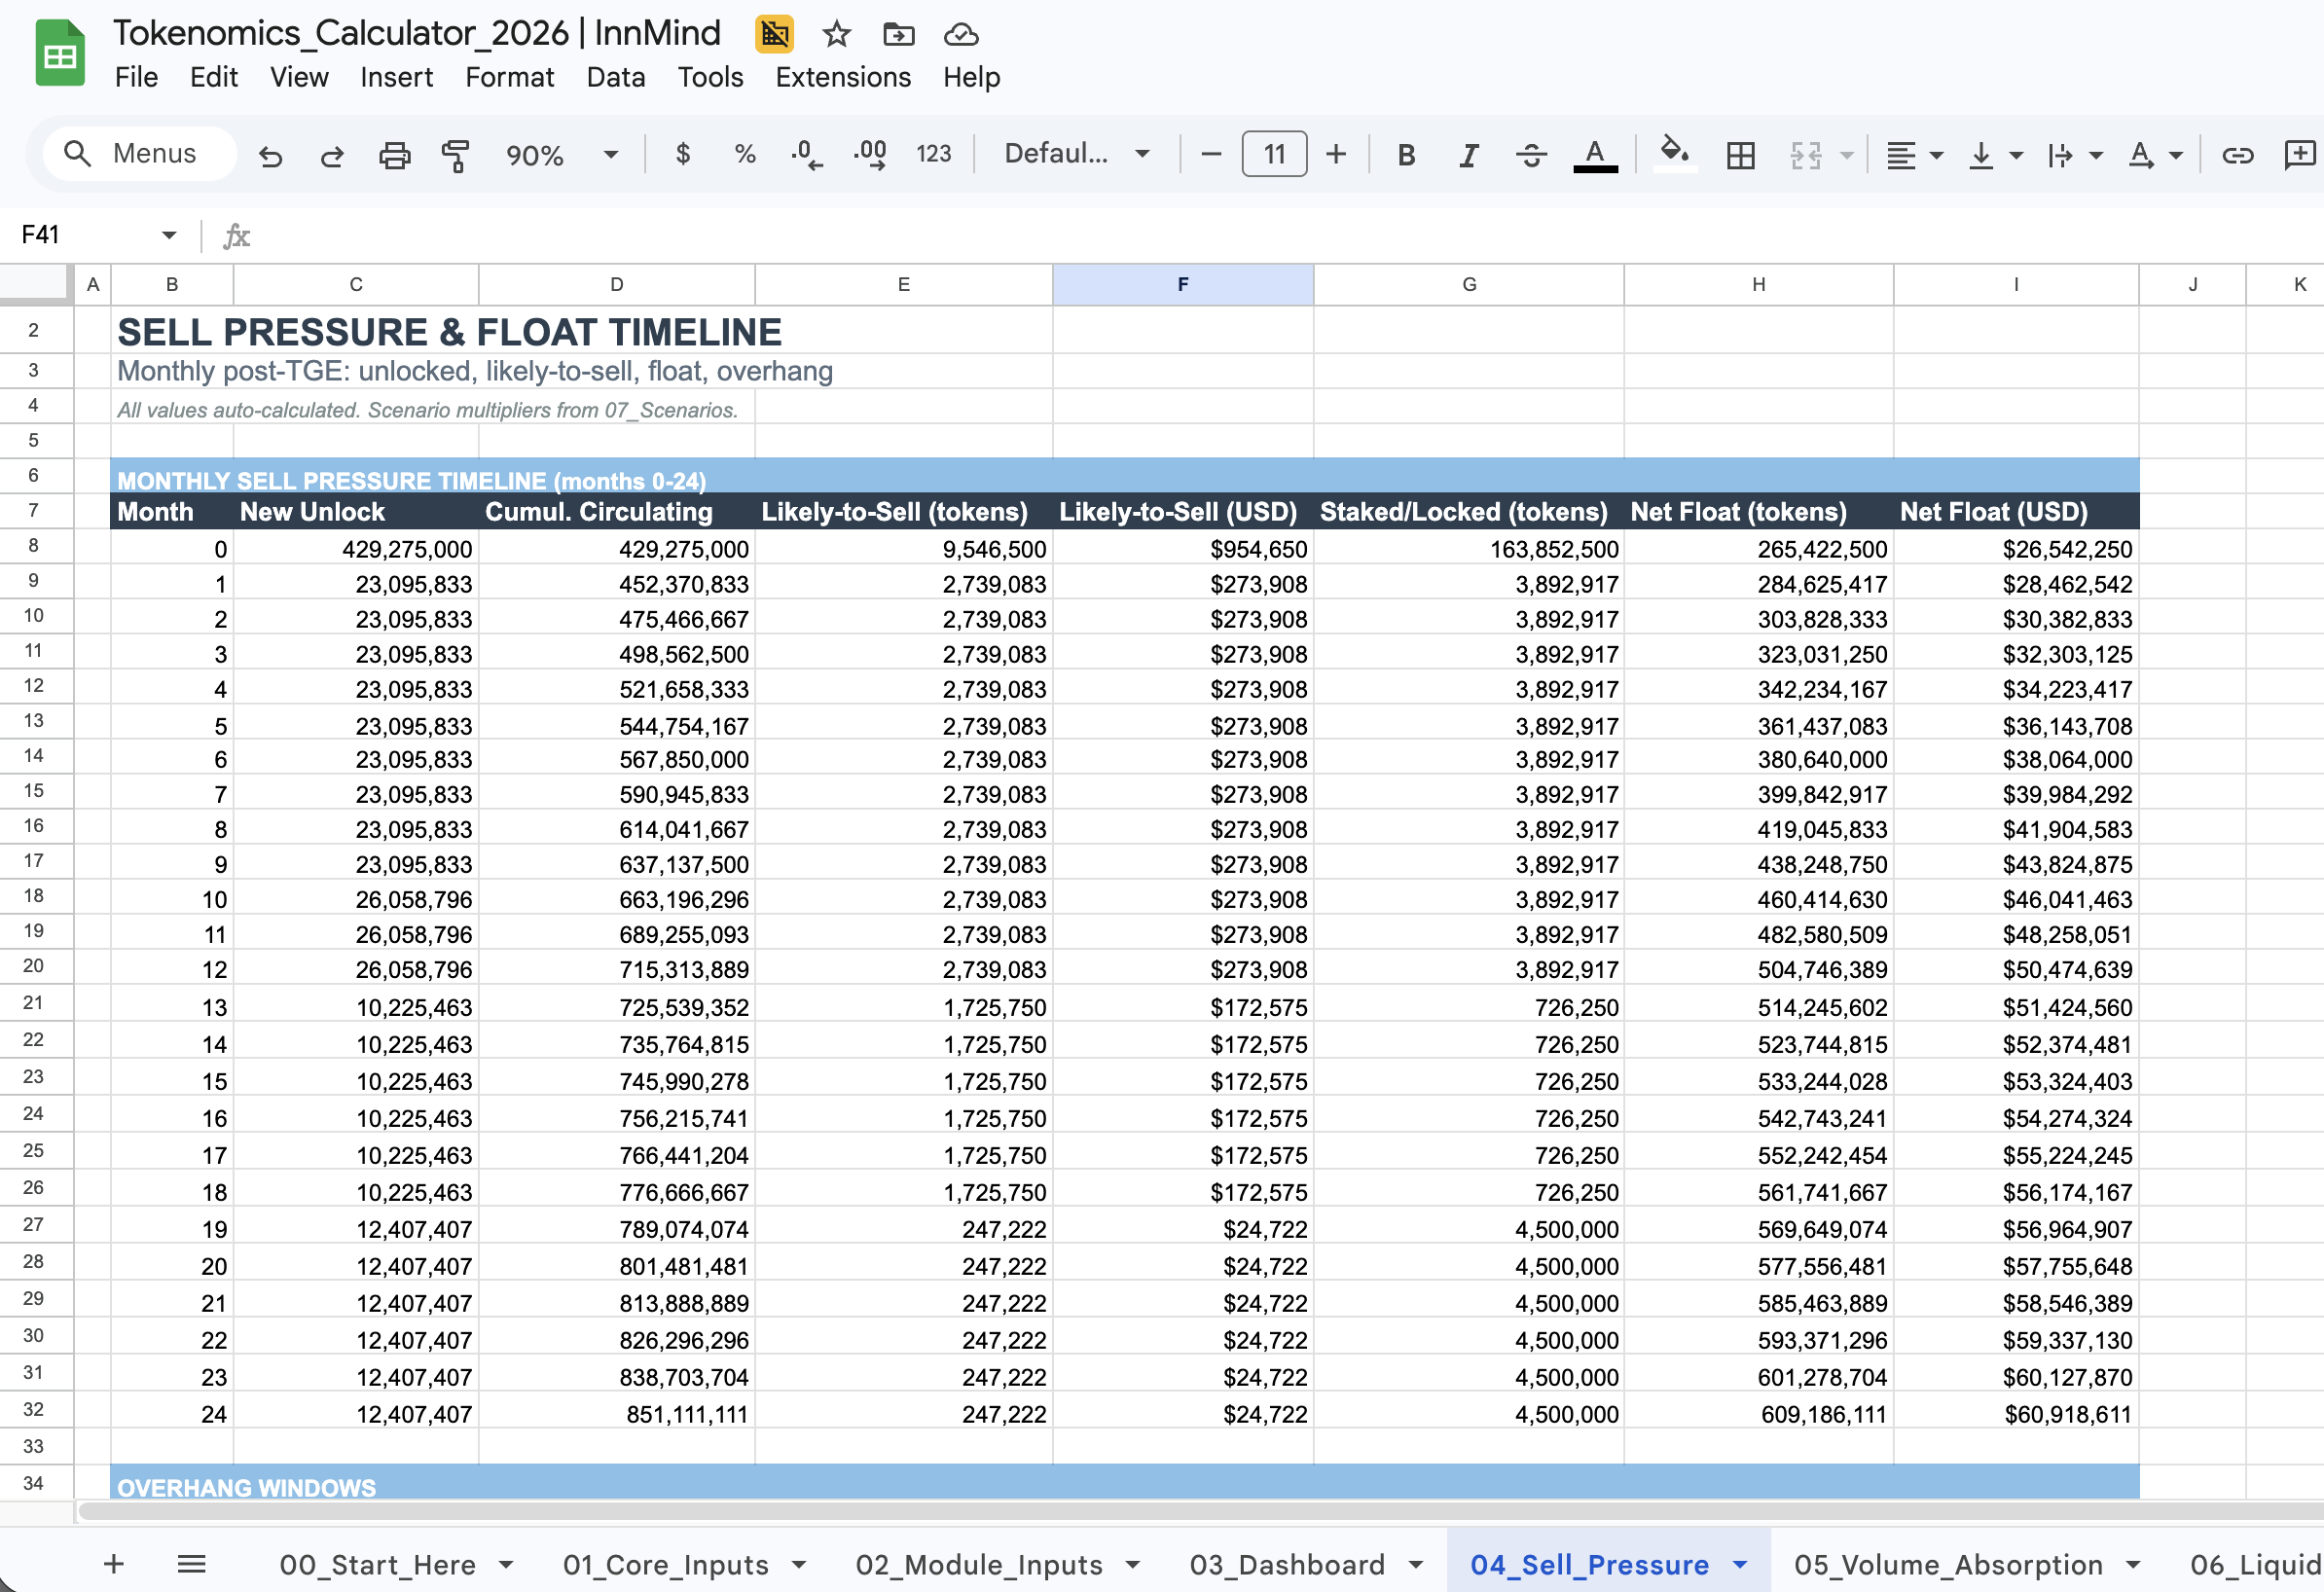
The 04_Sell_Pressure tab models this month-by-month and shows sell pressure in USD.
The overhang problem
Token overhang is unlocked supply sitting in holder wallets that has not been sold yet, typically because holders are waiting for price recovery. This creates sustained downward pressure even before holders act, because sophisticated market participants price the expected sell flow in advance.
Analysis of major unlock events from 2024 to 2025 (tracked by platforms like Token Unlocks and reported by Messari) shows consistent pre-unlock price weakness: tokens with large known unlocks tend to decline in the 15 to 30 days before the cliff date, as traders position ahead of the expected sell pressure. By the time the unlock arrives, some of the damage is already done regardless of whether holders actually sell.
In early 2026, projects with large near-term unlock schedules have faced market pricing pressure even before formal cliff dates. Some teams have delayed unlocks in response. The problem with this approach: delaying signals that the project believes the market cannot absorb the unlock, which markets also punish.
The fix is not in the unlock timing. It is in the vesting schedule design and the utility sink architecture, both of which need to be modeled before TGE, not renegotiated after.
The 04_Sell_Pressure and 05_Volume_Absorption tabs in the InnMind Tokenomics Calculator Pro calculate monthly sell pressure, volume absorption ratios, and overhang windows at 30, 90, 180, and 365 days automatically. Each window gets a Low, Medium, or High rating based on the same risk thresholds institutional investors use.
Compare sell pressure to actual market volume
Sell pressure is only a problem relative to volume.
A month with $500K in sell pressure is manageable if your market trades $50M in volume. It is fatal if your token trades $2M.
This is why institutional investors compare sell pressure to projected volume. They want the ratio.
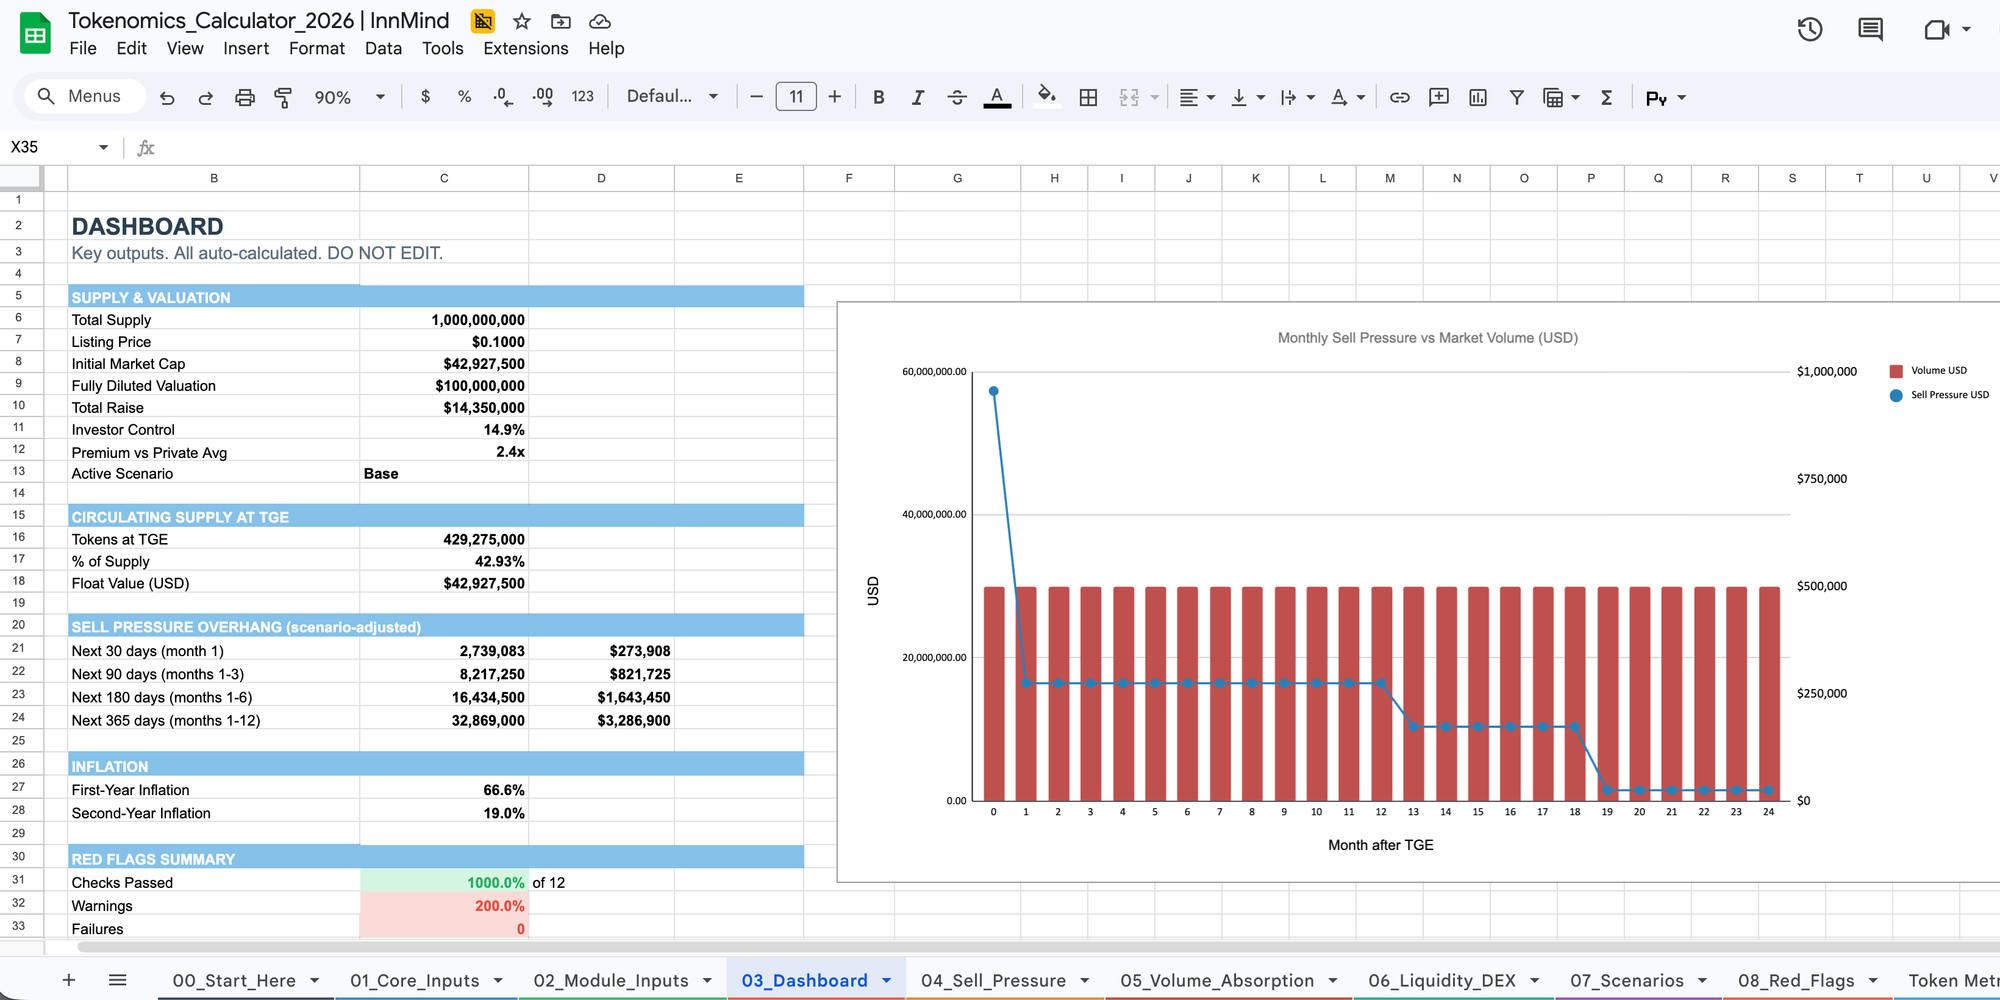
The calculator shows this on the dashboard as Monthly Sell Pressure vs Market Volume and as a Volume Absorption Ratio.
If your sell pressure exceeds 1 to 5% of projected volume in the first year, you need a mitigation plan. That plan can be vesting changes, staking sinks, or liquidity depth.
If you only do one thing from this article, do this:
- Open 03_Dashboard → check Month 12 sell pressure vs. volume.
- Switch to 07_Scenarios → set Bear → check 90-day overhang.
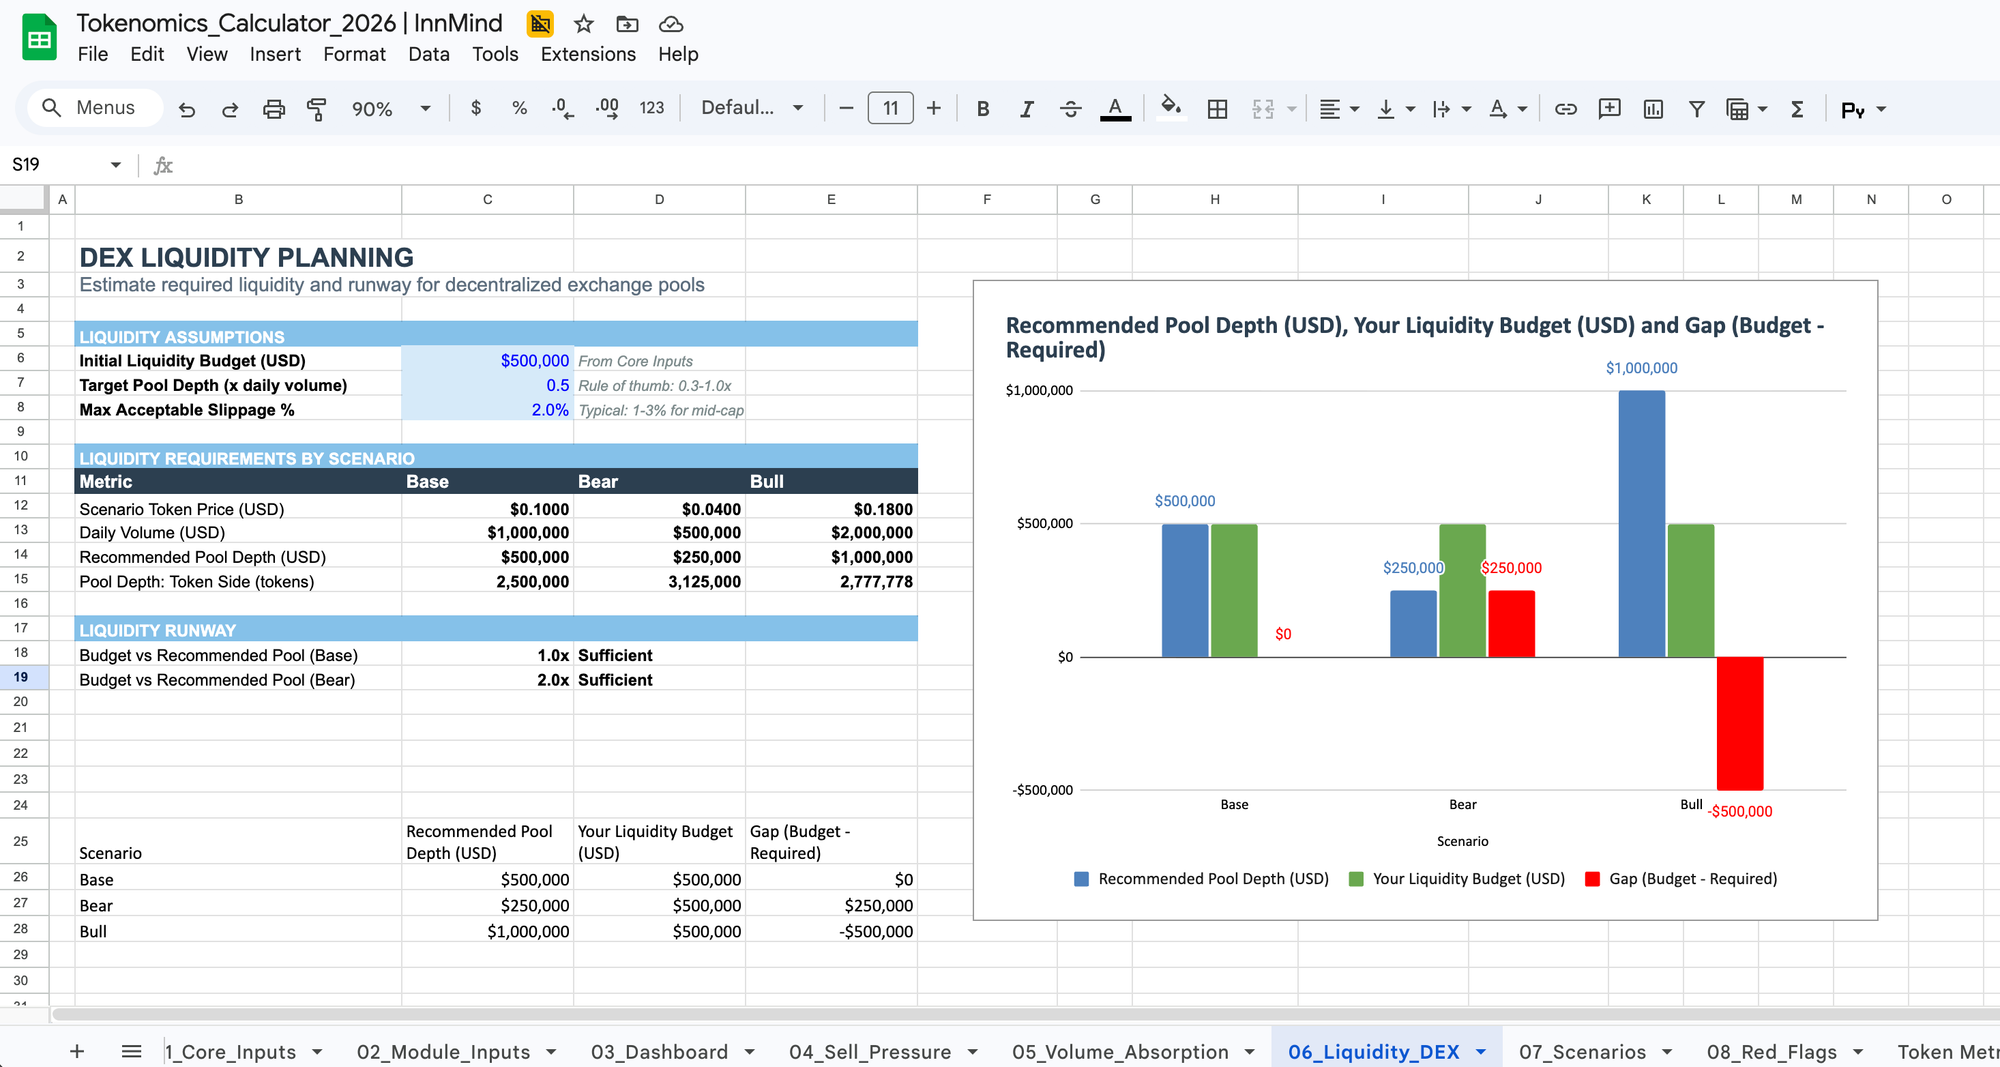
- Open 06_Liquidity_DEX → confirm your pool depth still works if volume comes in 50% below base.
Ready to run this as a proper model (not a template)?
Step 3: Plan Your DEX Liquidity Before You Price the Token
Why liquidity depth matters more than most founders think & determines day-one outcomes
Thin liquidity pools follow a predictable failure path. A moderate sell order generates high slippage. Arbitrage bots extract value from the pool immediately. Price drops. Holders panic-sell into already-thin liquidity. The pool drains. The project technically launched but is effectively dead within 72 hours.
The minimum target: pool depth sufficient to absorb at least 3 times your estimated Day-1 sell pressure at under 2% slippage. This is the floor, not the goal.
The practical tradeoff is real. Providing far more liquidity than needed ties up capital that the team needs for operations, marketing, and development. The goal is calibrated depth under different market scenarios, not maximum depth.
Scenario-plan your pool budget
The Bear scenario column is the one that matters most in planning. Nearly every project that ran into week-one liquidity problems had modeled their pool budget at Base or Bull assumptions and launched into Bear conditions. The liquidity reserve ran dry within days.
Before finalizing your allocation model, confirm that your liquidity reserve allocation in dollar terms at your expected listing price covers the Bear-scenario pool depth. If it does not, you either need to increase the liquidity reserve or reduce expected Day-1 sell pressure by adjusting vesting.
The 06_Liquidity_DEX tab in the InnMind's calculator outputs recommended pool depth under each scenario and flags whether your current liquidity reserve budget is sufficient. It estimates required pool depth based on your projected sell pressure, expected market volume, and target slippage assumptions.
Step 4: Model Unlock Overhang (The Silent Risk)
Why a single-scenario token model is a liability
A model built around one set of assumptions fails the moment conditions change. It also fails in the pitch room. Any VC who has run their own scenario analysis on your project can immediately show you what Bear conditions do to your numbers. If your model cannot match that conversation, you lose credibility before the negotiation starts.
Scenario modeling means adjusting four parameters simultaneously based on market environment: trading volume, holder sell behavior, staking participation, and token price. When all four move together in the right direction, every downstream metric changes.
The clearest indicator of a weak tokenomics model: it only works in Bull conditions. If sell pressure exceeds volume, liquidity reserve runs short, or inflation becomes unsustainable the moment you apply Bear assumptions, the token economy has a fundamental structural problem. The answer is to redesign now, not to hope for a Bull market at listing.
The question that ends meetings: "What happens to your sell pressure and liquidity coverage if volume is 50% below your base case?" If you cannot answer with a number, the conversation is effectively over.
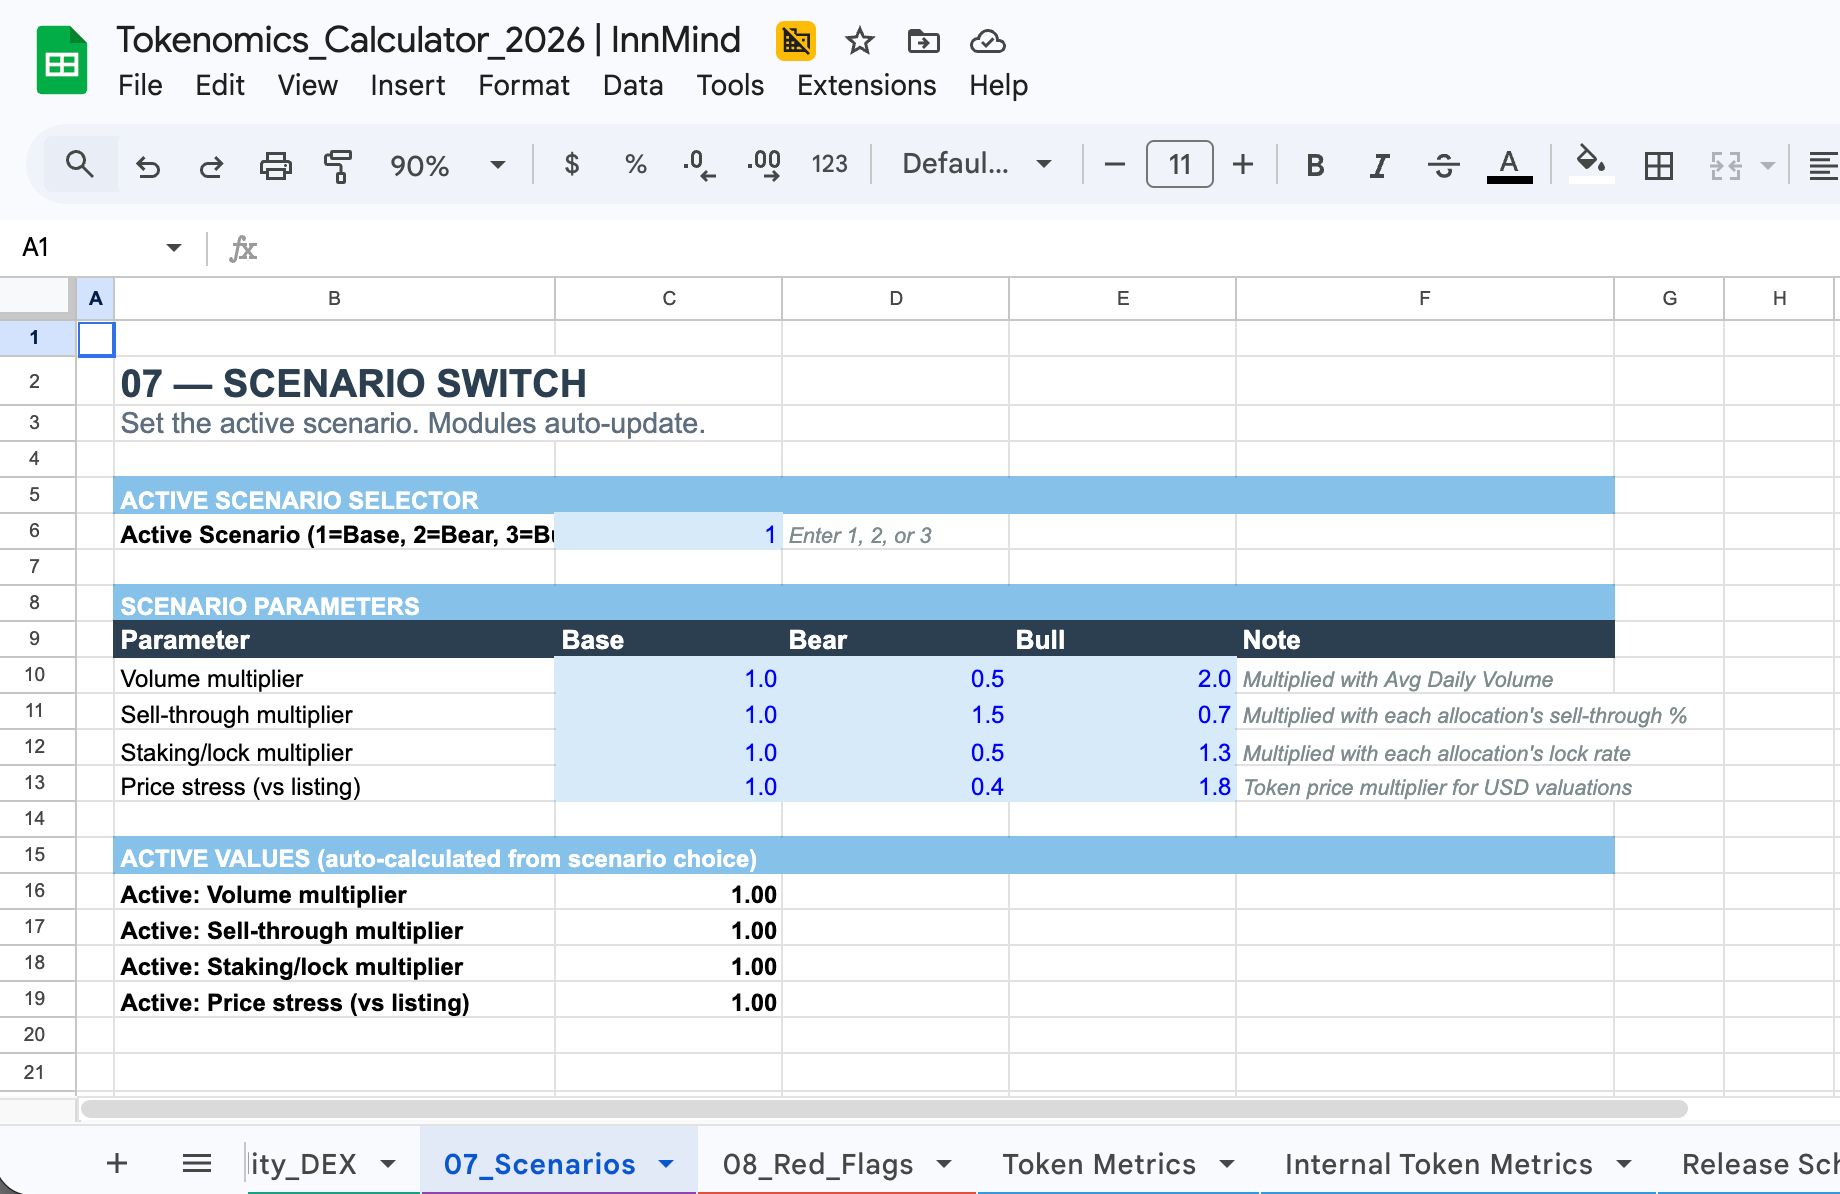
The 07_Scenarios tab in the InnMind Tokenomics Calculator 2026 switches between Base, Bear, and Bull with a single input cell. Every module updates automatically: sell pressure, volume absorption, liquidity planning, inflation rate. You can flip scenarios in seconds during a pitch to show you have already run the stress tests.
Step 5: Run the 12 Investor Red Flags Before You Send a Deck
Before any investor sees your tokenomics deck, run the same checklist their analysts run. Most founders find 2 to 3 issues they did not know were problems.
Investors do not need a full tokenomics audit to kill a deal. They need one red flag to pass.
The most common red flags show up in the first five minutes:
- Team cliff under 12 months. Institutional VCs treat this as a signal about founder commitment. Below 12 months, expect pushback or repricing.
- FDV/raise ratio above 50x at TGE. When early investors' tokens are worth 50 times the capital raised, there is an immediate and obvious incentive to sell into listing liquidity.
- Single round holds more than 30% of supply. One coordinated exit from a concentrated holder can be existential for token price.
- Public or IDO allocation unlocks more than 15% of supply at TGE. This typically exceeds day-one volume absorption capacity for early-stage tokens.
- No ecosystem or treasury allocation. Raises questions about protocol sustainability beyond initial token distribution.
- Listing premium more than 5x the last private round price. Gives every early investor a near-immediate and rational reason to exit.
- No staking or utility sink mechanism. Without a structural offset, sell pressure accumulates unchecked.
- Year-1 inflation above 40%. Token supply is expanding faster than any realistic adoption rate can match.
- Year-2 inflation above 25%. Unsustainable in typical bear conditions; dilution continues to pressure price.
- Sell pressure exceeds volume at any month in Year 1. Structural downward pressure is built into the design and will not self-correct.
- Any single unlock event releases more than 10% of circulating supply. The market cannot cleanly absorb a cliff event of this size.
- Liquidity reserve not funded to Bear-scenario depth. The most common and most consequential oversight.
These are not abstract theoretical concerns. Each maps to documented failure patterns from the 2022 to 2025 token market cycles. Versions of this checklist appear in public due diligence frameworks from funds including Multicoin Capital and Delphi Digital. The underlying logic is consistent across institutional investors even when the specific thresholds vary.
The 08_Red_Flags tab runs all 12 checks automatically against your model inputs and returns PASS or WARNING for each line. It takes about 3 minutes to run. What it finds usually takes several days to address. That is the correct order.
![12-point investor red flag checklist with automated PASS/WARNING results — Tokenomics Calculator 2026]](https://blog.innmind.com/content/images/2026/02/image-11.png)
It takes about 3 minutes to run. What it finds usually takes several days to address. That is the correct order.
What Institutional Investors Expect in 2026
The baseline has shifted noticeably over the past two to three years.
In 2022 and 2023, an allocation table and a vesting chart were sufficient to show that a team had thought about tokenomics. In 2024 and 2025, serious seed and Series A funds began asking for full unlock schedules and sell pressure estimates as a standard part of the process. By 2026, the expectation at most institutional funds is that founders can answer three specific questions with numbers, not estimates:
"What is your estimated sell pressure in Month 12 relative to projected volume?"
"What is your token overhang at 90 days under Bear market conditions?"
"Walk me through your DEX liquidity plan if volume comes in 50% below your base case."
Founders who can answer these with an actual model are demonstrating something specific: they have already done the stress-testing that investors would otherwise need to do themselves. That changes the dynamic of the conversation from "let us check if this holds up" to "let us discuss the design choices."
The model does not need to show perfect numbers. It needs to show that the founder understands which numbers matter and why.
TL;DR Checklist
Run through this before finalizing tokenomics and before any investor sees the document:
- A pro-grade tokenomics model includes post-TGE mechanics (sell pressure, overhang, liquidity), not only allocation.
- Concentration risk: no single allocation bucket >30% of total supply.
- TGE float target: 5–12% of total supply (below 5% = artificial scarcity risk; above 15% = immediate sell pressure risk).
- Team tokens: 12-month cliff minimum, 36-month linear vesting after
- Advisor tokens: 3-month cliff, 12 to 24 months total vesting
- Private investor tokens: 12 to 18 months post-TGE lockup before vesting begins
- 60-month unlock schedule built; no convergence events in Month 12 or Month 24
- Monthly sell pressure calculated using sell-through rates by allocation type (not a blended average)
- Volume absorption ratio checked for every month in Year 1; anything above 5% needs a plan
- Overhang modeled at 30, 90, 180, and 365 days post-TGE
- DEX pool depth covers Bear-scenario Day-1 sell pressure at under 3% slippage
- Bear scenario run: volume at 0.5x, sell-through rate +20%, price at 0.6x base
- All 12 red flag checks pass before the deck goes to any investor
Model First. List Second.
Every predictable token dump was visible in a spreadsheet before listing. The convergence events, the thin liquidity, the overhang at 90 days. None of it was hidden. It just was not modeled.
Building a complete tokenomics model takes 20 to 40 hours if you are building from scratch and know what you are doing. It takes considerably less time with a well-structured calculator. The cost of skipping it is visible on every price chart where a project with a real product and genuine traction flatlined at Month 12.
A complete model is also investor collateral. It answers the stress-test questions before investors ask them. It signals that you have already examined the hard part of your token economy. That alone changes how a fundraising conversation starts.
Tokenomics Calculator PRO (2026 Spreadsheet)
Investor-grade tokenomics model in one spreadsheet: sell pressure + overhang windows + liquidity planning + red-flag checks. Plug in your vesting & scenarios and get Month-12 risk + pool depth in minutes.
FAQ
What is a tokenomics calculator and why do I need one?
A tokenomics calculator is a spreadsheet model that computes your token's full economic lifecycle: supply allocation, vesting schedules, post-listing sell pressure, liquidity requirements, and automated investor risk checks. You need one because token economics affect every downstream decision, from fundraising valuations to DEX pool budget to long-term price stability. Projects that model their token economy before listing are materially better positioned to handle unlock events and investor questions than projects that use static allocation templates.
What is token sell pressure and how is it calculated?
Token sell pressure is the estimated USD value of tokens likely to be sold in a given month after listing. The formula is: (tokens unlocked that month) x (sell-through rate for that allocation type) x (1 minus staking absorption rate) x (token price). Sell-through rates vary by holder type: private investors typically sell 25 to 35% of their unlocked tokens per month, while team members sell 5 to 10%. Sell pressure becomes a risk when it exceeds 1 to 5% of the token's 7-day average trading volume.
What is the standard vesting schedule for team tokens in 2026?
The industry standard for team token vesting in 2026 is a 12-month cliff followed by 36-month linear vesting: four years total. Institutional venture funds treat this as a baseline minimum. Anything shorter raises concerns about founder commitment and is flagged in most professional due diligence processes. Advisor tokens typically use 1 to 2 year total vesting with a 3-month cliff. Private investors in seed and Series A rounds generally see 12 to 18 months of lockup post-TGE before their vesting begins.
What is token unlock overhang?
Token unlock overhang is the total supply of unlocked tokens sitting in holder wallets that are likely to be sold but have not been yet, typically because holders are waiting for a price recovery. Overhang creates sustained downward price pressure because sophisticated market participants price expected sell flow in advance, often 15 to 30 days before the formal unlock event. Projects can reduce overhang risk by staggering unlock schedules, building utility sinks such as staking and governance locks, and ensuring DEX liquidity is sufficient to absorb expected sell flow.
What are the most common tokenomics red flags that investors look for?
The most common flags institutional investors check in 2026: team tokens with a cliff shorter than 12 months; FDV-to-raise ratio above 50x at TGE; single allocation round holding more than 30% of supply; more than 15% of supply unlocking at TGE; listing price more than 5x the last private round price; no staking or utility sink mechanism; Year-1 inflation above 40%; and sell pressure that exceeds projected trading volume at any point in the first 12 months.
How much DEX liquidity should I provide at TGE?
A conservative baseline is DEX pool depth sufficient to absorb at least 3 times your estimated Day-1 sell pressure at under 2% slippage. In a Base market scenario, this means pool depth equal to roughly 200% of expected Day-1 sell pressure. In a Bear scenario, increase to 300%, because lower market volume means each dollar of sell pressure has greater price impact. Projects that underestimate Bear-scenario liquidity needs typically see pool drain within the first week of listing.
What is the FDV/raise ratio and why does it matter?
Fully Diluted Valuation divided by total capital raised measures how much the market is being asked to value the project relative to what investors actually put in. An FDV/raise ratio above 50x at TGE is a red flag because it gives early investors an immediate and rational incentive to sell: their tokens are on paper worth 50x what they paid, and listing provides the liquidity to realize that gain. Healthy ratios in 2024 to 2025 ranged from roughly 10x to 30x depending on sector and market conditions.
What is the difference between circulating supply and float?
Circulating supply is the total number of tokens that have been released from lockup. Float is the subset of circulating supply that is realistically available for trading: it excludes tokens held by long-term holders, stakers, locked in smart contracts, or otherwise inactive. Float is typically 40 to 70% of circulating supply in the early months post-TGE. Models that treat circulating supply and float as equivalent will overestimate the market's ability to absorb sell pressure.
How do I model a Base/Bear/Bull scenario for my token?
A scenario model uses a single toggle to adjust four parameters simultaneously: volume multiplier, sell-through rate adjustment, staking rate adjustment, and price stress multiplier. In a Bear scenario, volume is modeled at 0.5x Base, sell-through rate increases by 20%, staking rate decreases by 10%, and price is 0.6x Base. All downstream metrics update from those inputs. A model that only shows Base conditions is a single point of failure in an investor conversation.
What percentage of supply should be unlocked at TGE?
Most investor-ready projects target 5 to 12% of total supply in circulation at TGE. Below 5% can signal artificial scarcity and may not meet DEX listing minimums. Above 15% creates immediate sell pressure that early-stage tokens typically cannot absorb in day-one volume. Public/IDO allocations commonly unlock 10 to 25% of their portion at TGE, with the remainder vesting over 6 to 12 months.
Can I use a tokenomics calculator in Google Sheets or only in Excel?
Most professional tokenomics calculators are built in Excel (.xlsx format) but work in Google Sheets when uploaded to Google Drive. The requirement is formula compatibility: the calculator must avoid Excel-only functions such as IFS(), LAMBDA(), and XLOOKUP(), and also avoid Google Sheets-only functions like ARRAYFORMULA() or IMPORTRANGE(). A well-built calculator uses only IF, SUM, IFERROR, SUMPRODUCT, INDEX, and TEXT: functions that work identically in both environments.
What makes the InnMind Tokenomics Calculator 2026 different from free templates?
Free tokenomics templates almost always cover only the allocation layer: supply, buckets, and vesting. The InnMind calculator adds the post-TGE reality layer (monthly sell pressure, volume absorption, overhang windows) and the scenario layer (Base/Bear/Bull toggle that updates all modules simultaneously). It also includes a 12-point automated red flag checker aligned with institutional VC due diligence, and it opens with a realistic pre-filled example so every module is immediately readable before you enter your own data.