Creating Successful Tokenomics in 2026: Key Metrics to Consider
Learn how to design successful tokenomics in 2026 by focusing on the metrics that actually matter: token distribution and vesting, token velocity, network usage, and burn / buyback mechanics. A practical guide for Web3 and crypto startup founders.

Last updated: October 2026
As a web3 or crypto startup, securing funding is crucial to bringing your vision to life. However, creating a tokenomics that aligns with your business goals and benefits your community can be a complex and challenging task.
A well-designed tokenomics system can attract investors, drive adoption, and increase the value of your token. In this blog post, we'll take a deep dive into the key metrics to consider when creating successful tokenomics for your web3 startup.
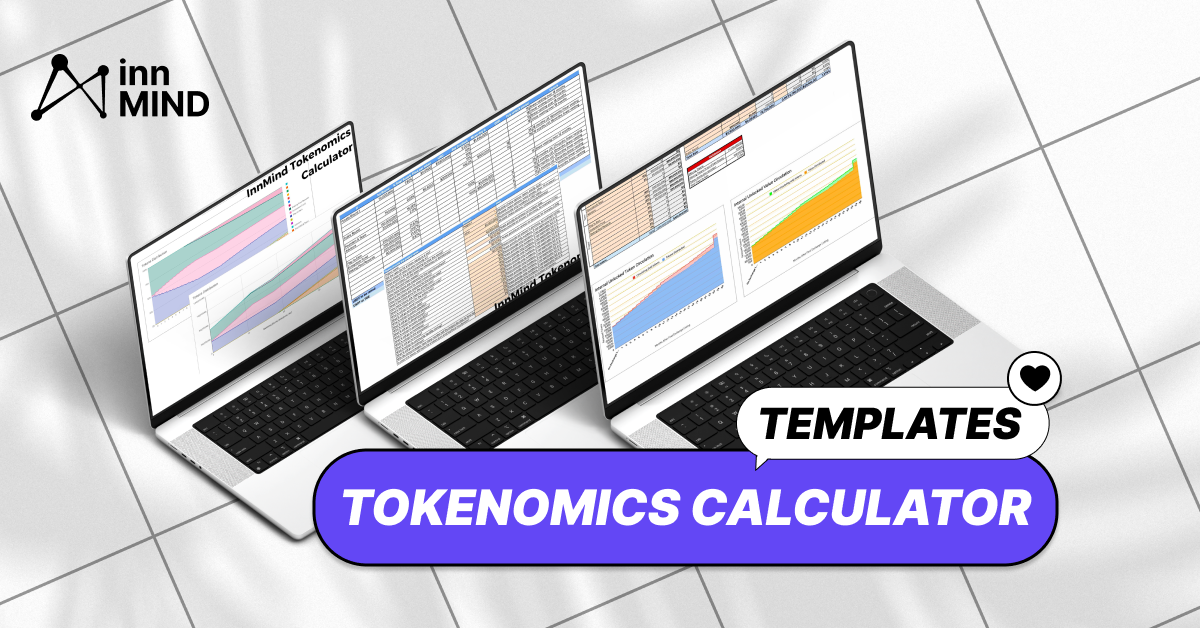
💡 PS: If you want a practical way to track all these metrics in one place, use InnMind’s Tokenomics Calculator PRO – it includes ready-made sheets for supply schedule, FDV, circulating market cap, token velocity and sell pressure by cohort.
How to Analyze Tokenomics in 2026: A 7-Step Checklist
This is the order our team follows when we review a token model before introducing a project to investors. Use it on your own model before TGE or a raise, or on a project you are about to back. Each step names the number to find & the red flag that should stop you. Below the table you can run steps 3 & 4 on your own numbers, then see the checklist applied to 4 tokens that launched in 2026.
| Step | What to check | Red flag |
|---|---|---|
| 1. Supply map | Share of supply for team, investors, treasury, community & public sale | Insiders hold most of the supply on short vesting |
| 2. Release schedule | Month-by-month calendar of cliffs & vesting events, by cohort | A large team or early-investor cliff lands in the first months after listing |
| 3. FDV vs market cap | Fully diluted valuation divided by circulating market cap at launch | The ratio is above 10 to 15x, with no plan for demand to grow before large releases |
| 4. Sell pressure | Tokens each cohort is likely to sell at each release, against expected daily trading volume | Expected selling from 1 release is bigger than daily volume |
| 5. Liquidity | Initial float, liquidity at launch & order-book depth at ±2% | Low float, thin depth & no market-making plan |
| 6. Utility | Whether users must hold or spend the token to use the product | A stablecoin or off-chain credit would do the same job |
| 7. Burns & buybacks | The revenue or fees that pay for them | Burns with no protocol revenue behind them |
Steps 2 to 5 move together: change 1 vesting term and FDV, sell pressure & liquidity needs all shift. That is why this check works best in 1 linked model. Our Tokenomics Calculator PRO builds the release schedule, sell pressure by stakeholder & month, DEX liquidity needs and base, bear & bull scenarios in 1 Google Sheet, with a Red Flags tab for investor-style checks. €199.
InnMind Tokenomics Quick Check: FDV/MC & Sell Pressure
Run steps 3 & 4 of the checklist on your own token. The fields hold example values: replace them with yours & the result updates as you type.
This checks 6 numbers. Tokenomics Calculator PRO models every cohort month by month, DEX liquidity needs and base, bear & bull scenarios, with a Red Flags tab.
Tokenomics Examples: 4 Tokens Launched in 2026, Run Through the Checklist
Here is the same checklist applied to 4 tokens that launched in March & April 2026. Each one shows a different step clearly, so read them as case studies, not a ranking. Prices, supply & volume come from CoinGecko, buybacks and fees from DefiLlama, allocations from each project's own docs, all as of 12 October 2026. Where a figure is our own calculation, the text says so. This is an analysis of public data, not investment advice.
| MegaETH (MEGA) | Backpack (BP) | edgeX (EDGE) | Gensyn (AI) | |
|---|---|---|---|---|
| Type | Ethereum L2 | Exchange token | Perp DEX | AI compute network |
| Launch | 30 Apr 2026 | 23 Mar 2026 | 31 Mar 2026 | 29 Apr 2026 |
| Float at launch | 11.3% | 25% | 35% | 13.05% |
| FDV vs launch market cap | 8.85x | 4.0x | 2.86x | 7.66x |
| Launch float value vs day-1 volume | 0.59x | 3.0x | 1.08x | 2.19x |
| Order-book depth at ±2%, share of market cap | 2.2% | 0.09% | 0.53% | 3.7% |
| Buyback | Paid from stablecoin yield | None documented | Paid from trading revenue, $47.3M so far | Paid from product fees, about $1.2K tracked |
| Price vs first recorded trade | -78% | +206% | -31% | -81% |
MegaETH (MEGA): a thin float priced near the line
MEGA went live on 13 exchanges with 11.3% of its 10B supply circulating, so FDV was 8.85x the launch market cap, just under the 10x line in step 3. More than half the supply, 53.3%, is reserved for staking rewards that are released only when the network hits usage milestones, so step 2 has no calendar to model. Investors (14.7%) & the team (9.5%) start vesting from 30 April 2027. The buyback is real but small: it runs on the yield the foundation earns from USDm, the chain's own stablecoin, which had about $16M in circulation, so by our estimate it funds under $1M a year against a $475M FDV. The price is 78% below its first recorded trade.
Lesson: when most of the supply is still to come & its timing depends on milestones, model those milestones as dates anyway, with a fast and a slow case.
Backpack (BP): the whole launch float was an airdrop
BP had no public sale & no direct team or investor allocation. All 25% of the launch float went to users as a fully liquid airdrop. At the first recorded price, that float was worth 3.0x the day-1 trading volume, the step 4 red flag in its plainest form, & the price fell about 69% to its May low. The other 75% splits into releases to users triggered by growth milestones (37.5%) and a corporate treasury locked until a year after a potential IPO (37.5%), which is where the team's exposure sits. FDV vs market cap is a calm 4.0x, but step 5 is the weak point: order-book depth within ±2% of the price is under 0.1% of market cap, with no spot pair on Binance, Coinbase, OKX or Bybit. The price is now 206% above its first recorded trade.
Lesson: a clean cap table does not remove sell pressure. Free tokens are sold like any other tokens, so size the airdrop against expected volume.
edgeX (EDGE): the strongest buyback of the 4, and its limits
On paper EDGE scores best: a 35% float, FDV at 2.86x the launch market cap and a 24-month cliff for team & investors. It also has the only buyback of the 4 paid for by real revenue: $47.3M of EDGE bought back from trading fees since April, with 4.94% of supply burned. 2 numbers change the picture. First, 141.7M EDGE (14.2% of supply) sits with liquidity partners under a 12-month lock, so the freely traded float at launch was closer to 21% by our estimate. At today's price & volume, that lock is worth about 15 days of trading when it ends around April 2027. Second, the buyback shrank from $23.4M in April to $0.6M in September as monthly fees fell from $22.2M in March to $4.2M in September. In early June the price dropped from $1.30 to $0.49 within 5 days, and it is 31% below its first recorded trade.
Lesson: check who actually holds the float, & check whether the revenue behind a buyback is growing or shrinking.
Gensyn (AI): a well-built buyback with almost nothing behind it
Team (25%) & investors (29.6%) hold 54.6% of the 10B AI supply. The 13.05% launch float looks normal, but about 808M of it is the first 20% of the community treasury, which the foundation controls. Without it, the public float was about 5% and FDV close to 20x that float, by our estimate. From 29 April 2027, team & investor tokens are released at about 227.5M a month for 24 months, roughly 17% of today's circulating supply every month. The buyback design is sound: USDC fees from Gensyn products buy AI on the market & 70% of it is burned. DefiLlama, however, tracks about $1,240 in fees so far from Delphi, the product that feeds it. The price fell below the $0.0473 public-sale price within 3 hours of launch and is 81% below its first recorded trade.
Lesson: a buyback is only as large as the revenue that pays for it, so ask for that number before you count the buyback as demand.
What the 4 launches show
- Headline float overstates tradable float. edgeX & Gensyn both traded on less supply than their circulating figure suggests.
- The 2 tokens with the thinnest public float & highest FDV vs market cap fell the most. MegaETH lost 78% and Gensyn 81%, while the 2 with lower ratios held up better. 4 tokens are not a statistic, but the pattern matches step 3.
- Buyback size matters more than having one. 3 of the 4 run a buyback; only edgeX's was large, & it shrank with fees.
Run your own token through the quick check above, or model every cohort month by month in Tokenomics Calculator PRO.
TL;DR - Tokenomics Metrics That Actually Matter in 2026
Creating “good-looking” tokenomics is easy. Designing a token economy that can survive listing, unlocks and multiple market cycles is hard. In 2026, the metrics that matter most are: how you structure token distribution and vesting, how you control token velocity, how network usage translates into real demand, and how buyback / burn mechanics are aligned with your business model instead of being pure narrative. This guide breaks down each metric with practical examples, so you can stress-test your tokenomics before launch or fundraising.
Token Distribution & Vesting Schedule:
Token distribution refers to the way in which tokens are distributed among the different participants in the network. It can have a significant impact on the value of the token and the success of the project.
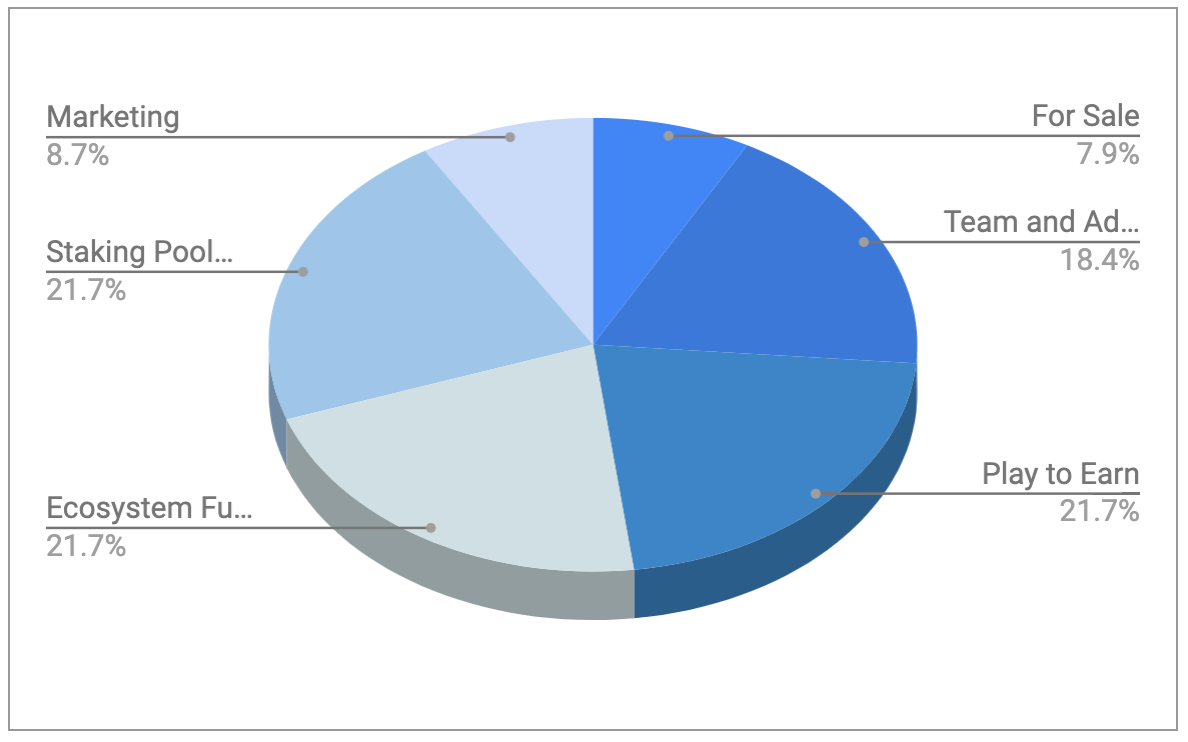
Here are a few key considerations when designing a token distribution strategy:
- Alignment with business goals:
The token distribution strategy should align with the business goals of the project and ensure that tokens are distributed in a way that supports the project's mission and vision. For example, a decentralized lending platform may choose to distribute tokens to borrowers and lenders, while a gaming platform may choose to distribute tokens to game developers and players.
- Fair and equitable distribution:
Token distribution should be fair and equitable, ensuring that tokens are distributed among different participants in a way that is proportional to their contributions or engagement with the network.
- Token issuance:
Token issuance refers to the creation and issuance of new tokens. This can be done through an initial coin offering (ICO), a token sale, or other methods of token issuance.
- Token vesting and release schedule:
Token vesting refers to the process of releasing tokens over time, rather than all at once. This can help to align the interests of different token holders with the long-term success of the project and prevent a sudden sell-off of tokens.
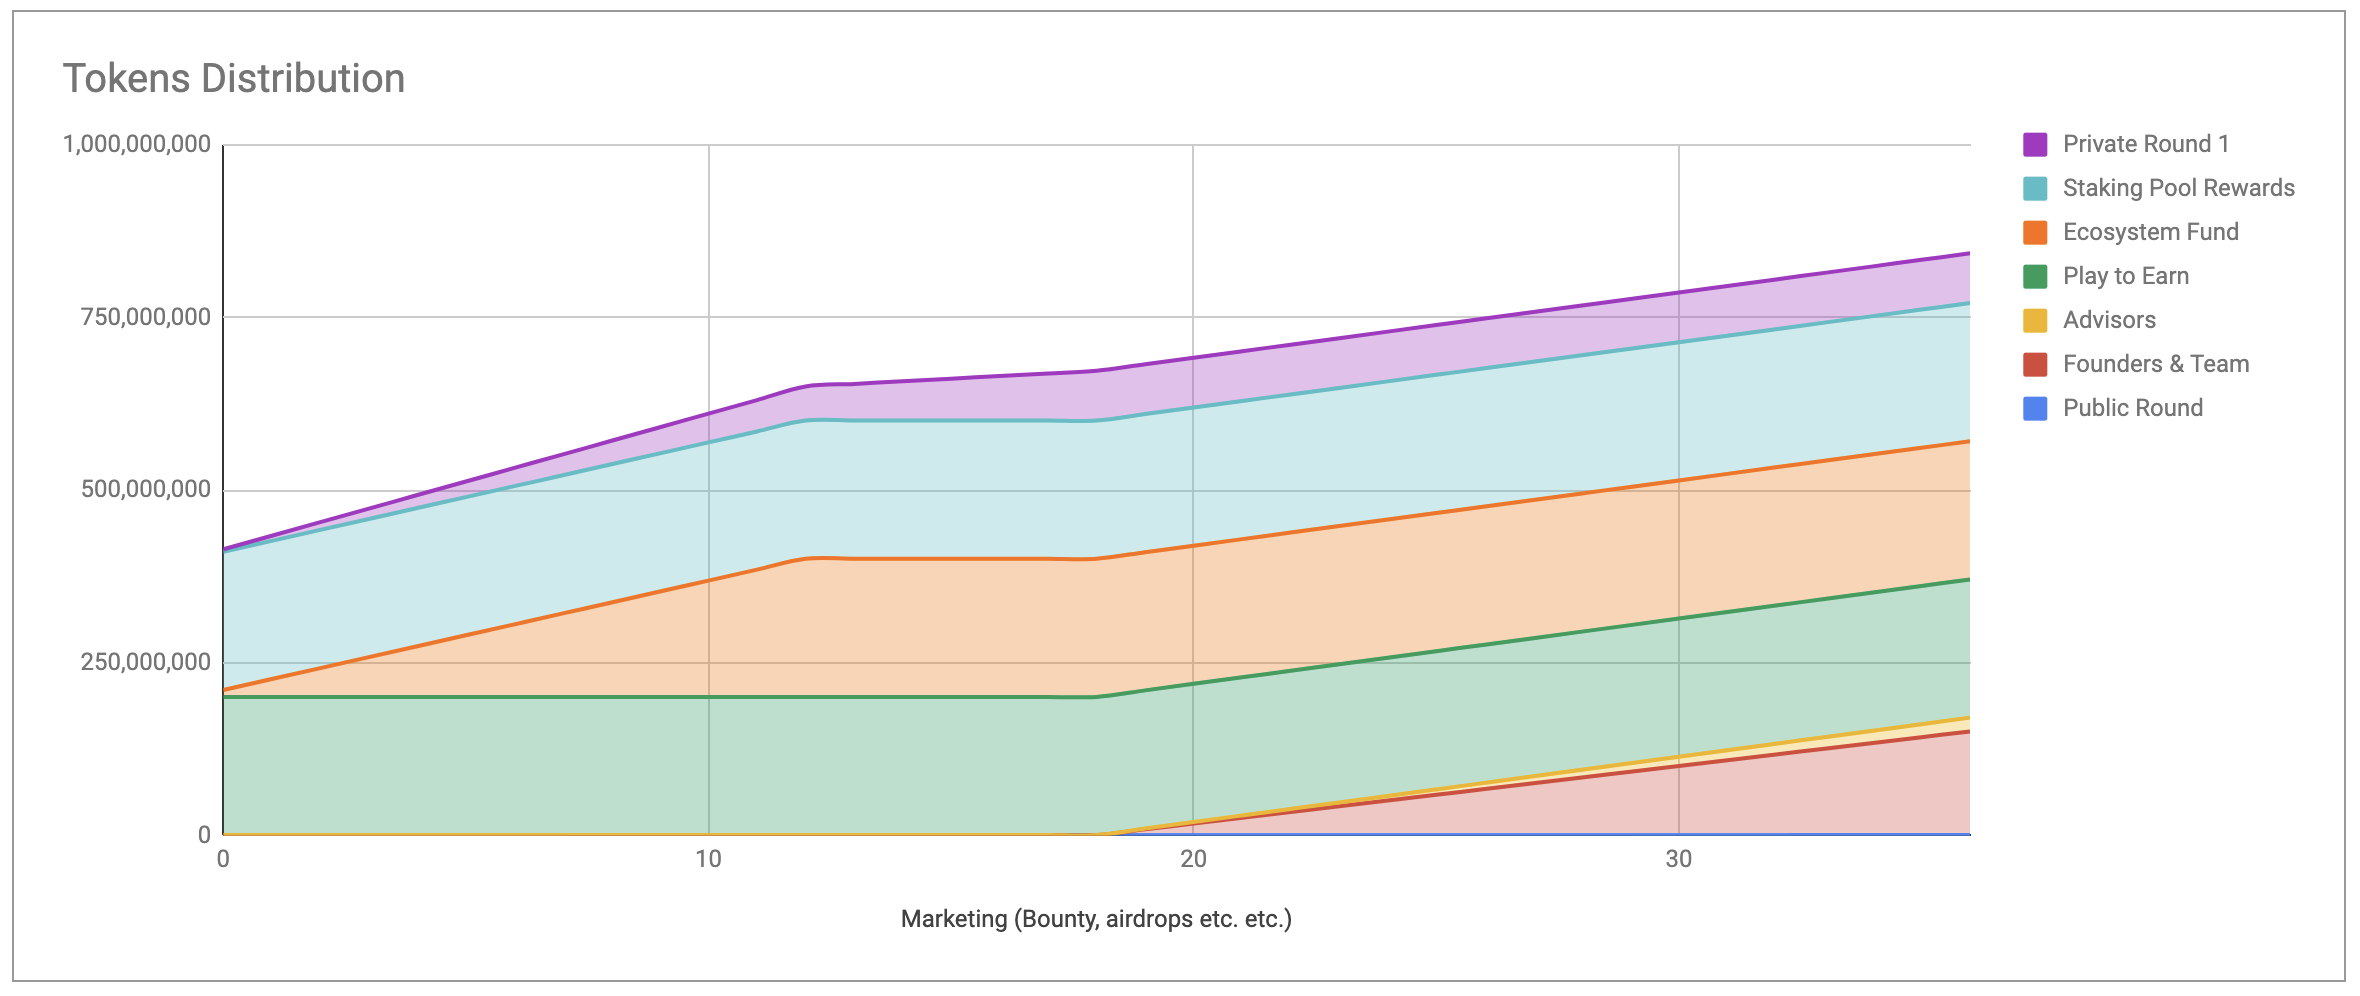
See the chart below, visualising the token release schedule within the 3-years period (example from this tokenomics calculator) 👇
It's important to remember the following:
a) Token vesting and token release schedule have an impact on the token selling pressure. For example, usually on the open market the token price on the exchange is challenged every time when a project has the token release date;
b) Token vesting conditions also affect the attractiveness of the project's tokens for investors. For example, if the project has several VC funding rounds and the difference in token price and vesting conditions is unbalanced towards the interests of earliest investors, it will be very hard to get VCs on the next funding round since they won't be incentivised to join on unfavourable conditions.
- Token burning:
Token burn mechanics is a process in tokenomics where tokens are permanently removed from circulation. This can be done for various reasons, such as to reduce the total supply of tokens and increase their value, or to reward holders with newly created tokens. Token burns also help maintain the scarcity of a token and its underlying asset.
- Token buyback:
Token buyback refers to the process of buying back a certain amount of tokens. This can be used as a mechanism to control the token's supply and thus its price.
FDV vs Market Cap Ratio: One of the Most Critical Tokenomics Metrics in 2026
One of the key metrics used by investors, market makers and exchanges in 2026 is the ratio between the token’s fully diluted valuation (FDV) and its circulating market cap (MC) at launch.
When FDV is extremely high while the initial circulating supply is very low, the project creates a structural sell-pressure problem. As unlocks begin, circulating supply grows much faster than real demand, pushing the price down.
Healthy projects aim for:
- FDV/MC ratio under 10–15×,
- organic growth of MC before large cliffs unlock,
- transparent communication about post-TGE supply expansion.
Modeling FDV/MC scenarios in advance is now a standard requirement for seed- and Series-A-stage investors evaluating tokenized startups.
Sell Pressure Modeling: Forecasting How Unlocks Impact Price
Modern tokenomics requires understanding not only when tokens unlock, but who receives them and how each cohort typically behaves.
Different groups (team, early investors, ecosystem partners, community rewards) have different liquidity needs and different risk tolerance.
If a large cohort unlocks in a weak market, the expected sell pressure may exceed daily trading volumes, causing structural price decline no matter how strong the product is.
A proper tokenomics model simulates:
- unlocks per cohort,
- expected % of sell-through,
- comparison of sell pressure vs liquidity and expected demand.
Without this modeling, even well-designed token distributions collapse under predictable unlock cycles.
Token Velocity: How Fast Your Token Moves
Token velocity refers to the rate at which tokens are exchanged within the network.
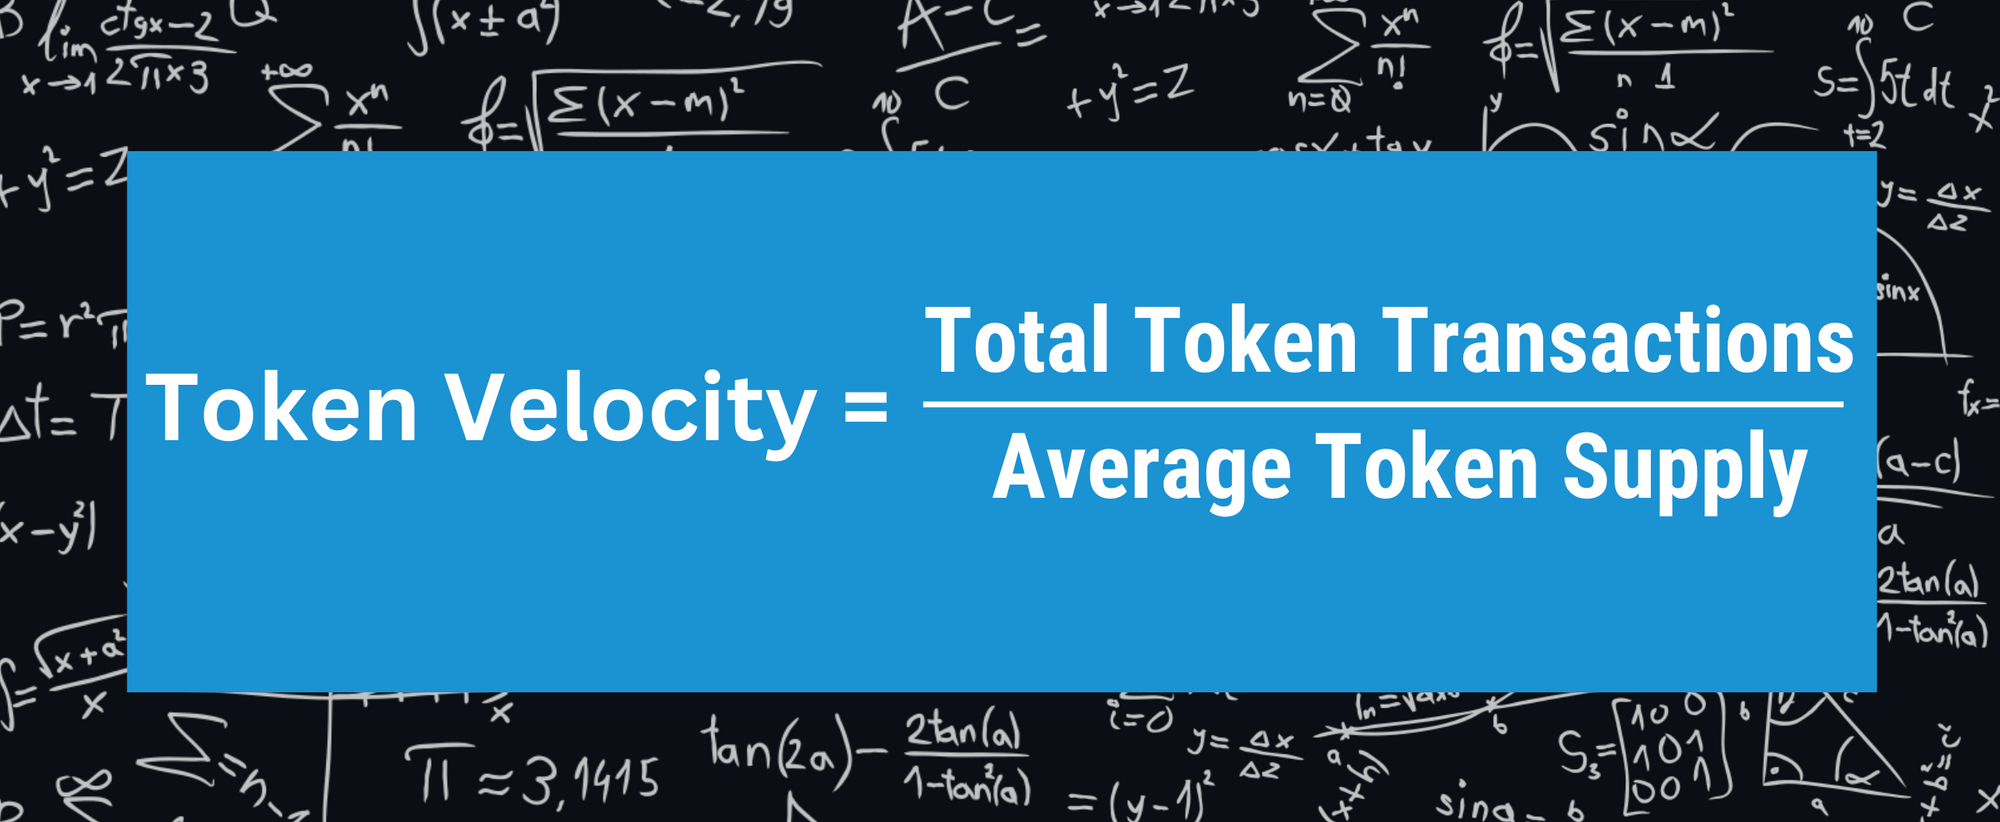
It's typically calculated by taking the total volume of token transactions over a certain period of time and dividing it by the average token supply during that same period.
It's important to note that the time period and the way the token supply is measured can vary depending on the context and the specific project. Some use transaction count, some use the volume of transactions, and some use the number of unique addresses.
For instance, in some projects token velocity can be calculated as the number of unique token transactions over time divided by the total token supply.
A high token velocity can lead to a decrease in the value of the token, as it indicates that tokens are being exchanged at a rapid rate and are not being held for long periods of time. This can happen when token holders are not incentivized to hold their tokens or when there is a lack of demand for the token.
So it's important to consider how to incentivize holders to keep their tokens for a longer period of time. For example, by implementing mechanisms such as token buyback, token burning, token vesting or token staking programs the web3 project can potentially increase the token holders' incentives to hold the token and reduce it's velocity.
Get new InnMind guides for founders by email. Fundraising, tokenomics & startup perks, sent when we publish. Unsubscribe anytime.
Here are the factors that impact startups’ token velocity:
- Number of token transactions: The number of token transactions can be used as an indicator of token velocity. A high number of token transactions can indicate a high token velocity, while a low number of token transactions can indicate a low token velocity.
- Time between token transactions: The time between token transactions can also be used as an indicator of token velocity. A short time between token transactions can indicate a high token velocity, while a long time between token transactions can indicate a low token velocity.
- Token holders: The number of token holders can also be used as an indicator of token velocity. A high number of token holders can indicate a low token velocity, as tokens are being held by a larger number of people. While a low number of token holders can indicate a high token velocity, as tokens are being held by a smaller number of people and are being exchanged more frequently.
- Token holding periods: Token holding periods can also be used as an indicator of token velocity. A long token holding period can indicate a low token velocity, as tokens are being held for a longer period of time. While a short token holding period can indicate a high token velocity, as tokens are being held for a shorter period of time and are being exchanged more frequently.
Network Usage & On-Chain Activity
Network usage refers to the number of transactions that take place on the network. A high level of network usage can indicate a strong demand for the token, which can in turn increase its value.
For example, a web3 startup that is building a decentralized lending platform, can measure network usage by counting the number of loans originated and repaid on the platform. If the number of loans is increasing over time, it could indicate that there is a growing demand for the token, which can in turn increase its value.
Another example, a web3 startup building a gaming platform, can measure network usage by counting the number of game rounds played and the number of in-game purchases made. This information can be used to track the popularity of the game and the engagement of the players, which can also indicate the demand for the token.
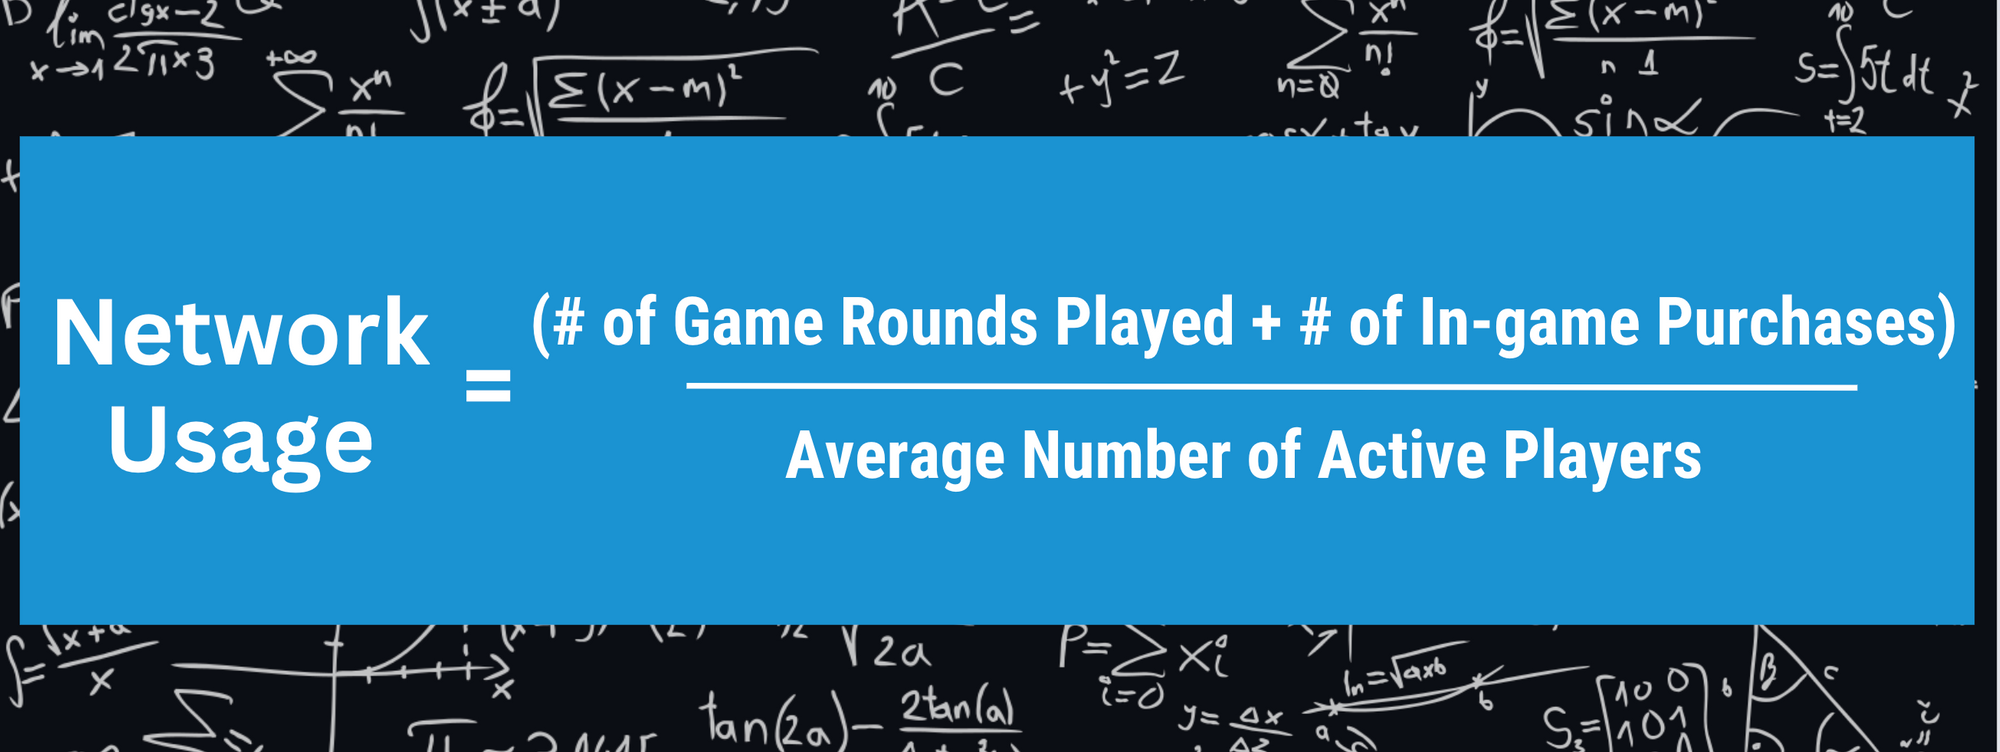
⚠️ Note that the example above is for educational purpose only and shouldn't be blindly applied for every startup. If you want to calculate the network usage for your specific case, use this form to apply for a session with tokenomics expert.
It's important to note that measuring network usage can be complex and can vary depending on the specific use case of the token and the nature of the network. It's also important to consider other factors such as the number of active users, the number of transactions per user, and the value of transactions when assessing network usage.
Counting network usage in tokenomics of a web3 startup can be compared to creating a financial forecast or monetization plan for a web2 startup, where you predict the future growth of active users and/or customers of the product. Both are methods of estimating future revenue and growth potential of a business model.
In the case of a web2 startup, the financial forecast would typically focus on revenue streams such as advertising, subscriptions, and sales, while a tokenomics system would focus on token usage and network activity as a means of estimating the potential value of the token.
>>> BTW, love💜 this post? Tweet it! <<<
Both methods involve making assumptions about future growth and user behavior, and both can be influenced by various factors such as market conditions, competitive landscape, and product development. In both cases, it's important to use data and industry trends to make informed estimates and to be mindful of potential risks and uncertainties.
In summary, network usage in tokenomics serves as a metric that can indicate the potential value of a token, by measuring how active the network is and how many transactions are taking place on it. This can be useful for web3 startups to predict the future growth of their product or platform, and it can be used as a key metric for the tokenomics system.
If you don’t want to calculate all these tokenomics metrics manually, use our Tokenomics Calculator PRO. It lets you model token distribution, vesting, token velocity, network usage, buyback and burn scenarios in one spreadsheet — the same framework we use internally to review token economies before introducing projects to investors.
Utility Design: Ensuring the Token Has Real, Repeatable Demand
A token can only retain long-term value if the network creates structural, recurring demand for it.
In 2026 investors specifically look for utilities that cannot be replaced by stablecoins or off-chain credits.
Examples of strong utility include:
- using the token for protocol fees,
- gas fees, essential product features access, etc.,
- token as a mean of payment/commissions within ecosystem,
- locking for access to high-value features or staking yield,
- collateral or liquidity provisioning,
- reward multiplier logic that reinforces long-term holding.
Utility should create buy pressure, not only reward emissions.
If utility is weak, velocity rises and price cannot sustain unlock cycles.
Liquidity Strategy: Depth, Market Makers and Initial Float
Even the best tokenomics model fails if liquidity is too shallow.
Token listings in 2023–2025 repeatedly show that tokens with low initial float, weak liquidity depth and no coordinated MM strategy experience extreme volatility and rapid price decay.
A complete tokenomics plan must specify:
- initial liquidity (USDT/ETH pairs) and depth at ±2%,
- coordinated market-making strategy (internal or external),
- expected daily trading volume relative to unlock size,
- how liquidity scales with user growth.
Price stability is not only a function of supply - it’s a function of liquidity vs unlock pressure.
Token Burn Mechanics & Supply Control:
Token burn mechanics refers to the process of destroying a certain amount of tokens, with the purpose of decreasing the overall supply of tokens in circulation, and thus increasing the value of the remaining tokens. Token burn can be a powerful tool to control the token's supply and affect the token's value.
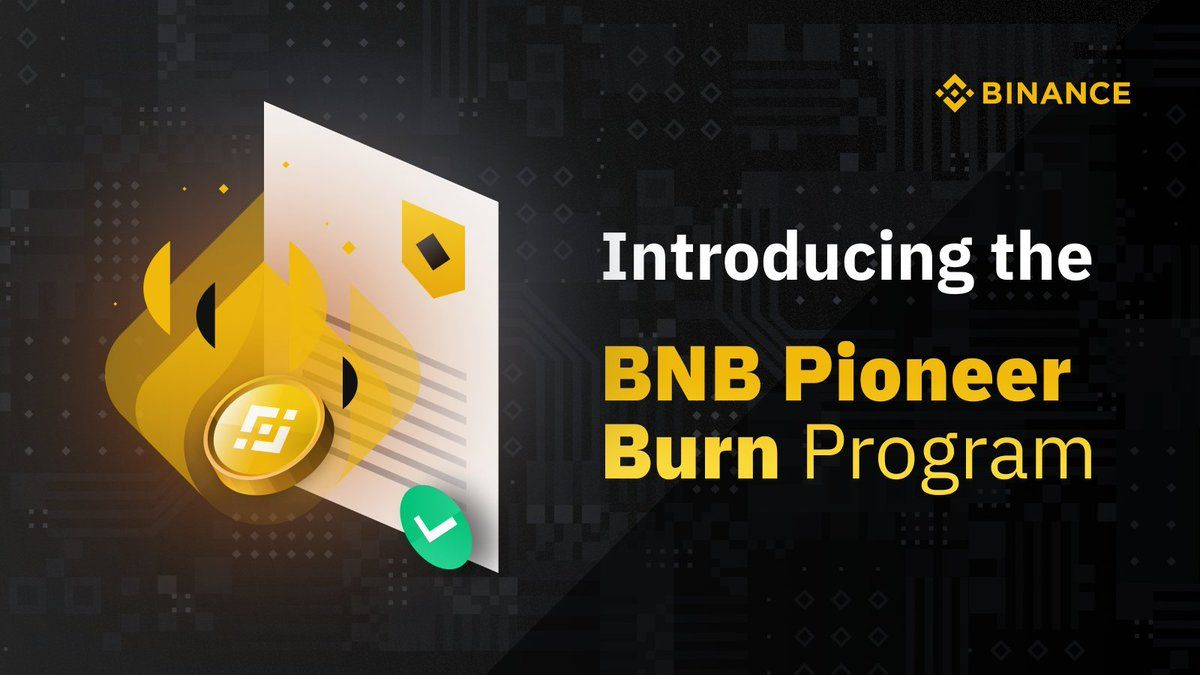
For example, Binance, a leading cryptocurrency exchange, implemented token burn mechanics for its native token Binance Coin (BNB). Binance burns a portion of the BNB tokens each quarter, based on the trading volume on the exchange. This decreases the overall supply of BNB tokens, which in turn increases the value of remaining tokens.
- Stellar (XLM): Stellar burns a small percentage of the total XLM supply every year, reducing the total number of tokens in circulation.
- Huobi Token (HT): Huobi exchange burns a certain percentage of HT tokens every quarter, reducing the total number of tokens in circulation.
- MakerDAO (DAI): MakerDAO burns MKR tokens when the price of DAI is too high, reducing the total number of tokens in circulation.
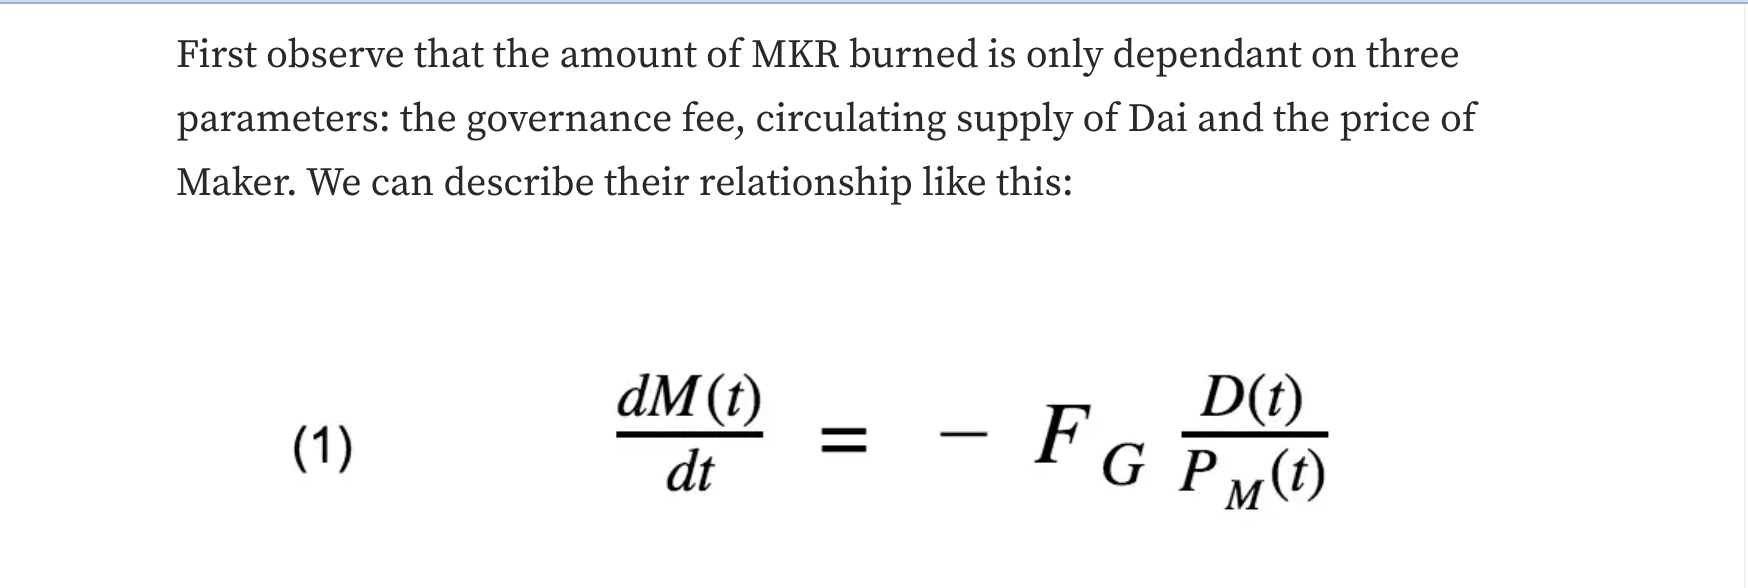
In these (and many other) examples, token burn mechanics is used as a way to control the token's supply and affect the token's value, aligning token holders' interests with the long-term success of the project.
Note: token burn mechanics is not a mandatory part of tokenomics but can be used as a separate mechanism to influence the token's value or to align token holders' interests with the long-term success of the project.
Token Buyback Mechanics & Legal Considerations
Token buyback refers to the process of buying back a certain amount of tokens. This mechanism can help control the token's supply and thus its price.
Here are a few examples:
- DigixDAO (DGD) : DigixDAO uses a buyback mechanism where they buy back DGD tokens from the market and burn them, reducing the total supply of DGD tokens in circulation.
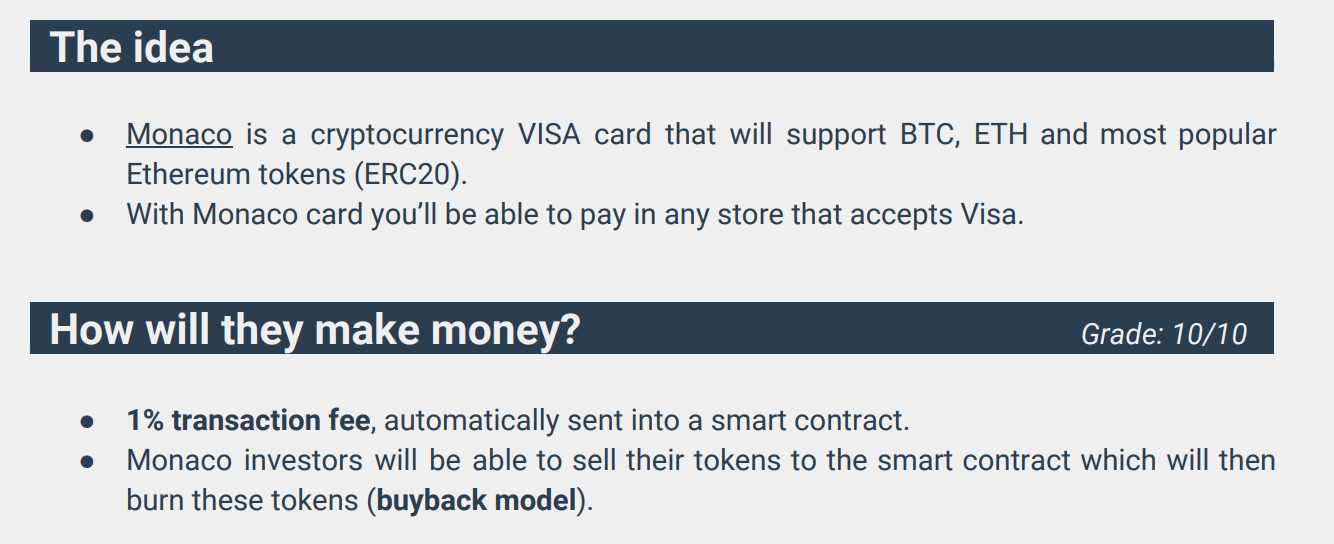
- MCO (Monaco): Initially Monaco (now known as Crypto.com) has implemented a buyback mechanism where they buy back MCO tokens from the market and burn them, reducing the total supply of MCO tokens in circulation.
- BitShares (BTS): BitShares uses a buyback mechanism where they buy back BTS tokens from the market, reducing the total supply of BTS tokens in circulation.
But be careful: in some jurisdictions, buying back tokens from the market may be considered a form of "repurchasing" and may be subject to securities laws.
The advice to avoid this is to consult with legal counsel to ensure that the token buyback mechanism is compliant with all applicable laws and regulations. They will be able to provide guidance on the specific laws and regulations that may apply to the project, and can also help to structure the buyback mechanism in a way that minimizes the risk of it being considered a security.
In addition, it's important to be transparent about the buyback mechanism and to clearly communicate the terms of the buyback to token holders. This can help to reduce the risk of confusion or misunderstandings and can help to build trust with token holders.
And of course, while creating the token buyback mechanism you should not forget to consider the use case of the token and the nature of the network when designing a buyback mechanism, as well as the goals of the project and how the buyback mechanism aligns with those goals (fill in this form if you wanna get professional advice on your tokenomics).
Tokenomics Metrics - FAQ
How do you analyze tokenomics in 2026?
Check 7 things in order: who holds the supply, the release schedule, FDV against launch market cap, sell pressure per cohort, liquidity depth, real utility, and whether burns or buybacks are paid for by revenue. The checklist at the top of this guide gives the red flag for each one.
What are real tokenomics examples from 2026?
MegaETH, Backpack, edgeX and Gensyn all launched in March or April 2026, and each shows one checklist step clearly: MegaETH launched near 9x FDV vs market cap, Backpack with an airdrop worth 3x day-1 volume, edgeX with a revenue-paid buyback that shrank with fees, and Gensyn with a buyback that has almost no revenue behind it. The examples section above runs all 4 through the checklist.
What are the most important tokenomics metrics for Web3 startups in 2026?
The key metrics that still matter most in 2026 are: how tokens are distributed and vested over time, how fast your token circulates (token velocity), how network usage and on-chain activity create real demand, and how burn and buyback mechanics are aligned with your business model. Hype metrics like “huge total supply” or “very low price per token” are much less important than these fundamentals.
How does token distribution affect investor perception and price?
Token distribution defines who controls supply at each stage: team, investors, treasury, community and public sale participants. If too much supply is concentrated in early insiders with short vesting, markets will expect heavy sell pressure at unlocks. A balanced distribution with sensible cliffs and long-term vesting sends a much stronger signal to investors and reduces fear of future dumps.
What is token velocity and why can high velocity be a problem?
Token velocity measures how quickly tokens move between holders over a given period. Very high velocity usually means people are trading or selling the token instead of holding or using it. That can put constant downward pressure on price. Well-designed staking, vesting, real in-product utility and loyalty mechanics can help keep healthy, sustainable velocity.
How should Web3 founders think about network usage as a metric?
Network usage is the bridge between product traction and token value. Rather than chasing vanity metrics, focus on clear KPIs: active wallets, meaningful transactions per user, in-app purchases, loans originated, games played, etc. Your tokenomics should be designed so that growth in these metrics naturally creates demand for the token instead of being loosely connected.
Are token burn and buyback always good for token price?
Burn and buyback mechanics can support price only if they are backed by real economics: protocol revenue, fees, or other sustainable cash flows. Pure narrative burns with no real economic engine behind them are unlikely to have a lasting impact. It’s also important to consider legal and regulatory implications of buybacks in your main jurisdictions and get proper legal advice.
Summary: Putting Tokenomics Metrics Together
Creating a successful tokenomics requires a deep understanding of the key metrics that drive the value of your token.
Token distribution, token velocity, network usage, token burn and token buyback are all crucial factors to consider when designing a tokenomics that aligns with your business goals and benefits your community.
To ensure that your tokenomics is well-balanced and designed properly, this Tokenomics Calculator can be a great tool for you to save a lot of time and nerve cells on structuring, calculations and fixing errors.
The Calculator PRO is also included in InnMind membership, together with every database & template in our library. If you also need investor lists for the raise, membership covers both.
You'll also like:
 Maxim Krasnov

InnMind Tokenomics Calculator template PRO: Advanced Spreadsheet for Web3 startups
 Nelli Orlova
The Ultimate List of 170+ Active Crypto VC Firms

InnMind video about Web3 fundraising mistakes